我为r leaflet代码添加了图例,输出结果如下:
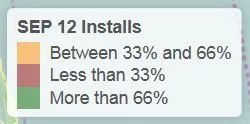
- 绿色 "超过 66%"
- 橙色 "介于 33% 和 66% 之间"
- 红色 "少于 33%"
代码
sep <- read.csv("31R_SEP_assets_csv - Copy.csv")

Sub1 <- sep[grep("SEP.12", names(sep))]
sep$newCol <- 100*rowSums(Sub1)/rowSums(sep[4:7])

# create a new grouping variable
Percent_SEP12_Assets <- ifelse(sep[,8] <= 33, "Less than 33%", ifelse(sep[,8] >= 66, "More than 66%", "Between 33% and 66%"))

Color_Assets <- colorFactor(c("darkgreen","darkorange","darkred"),
                               levels = Percent_SEP12_Assets,ordered=FALSE)

leaflet(data = sep[]) %>%
  setView(lng = mean(sep$Longitude), lat = mean(sep$Latitude), zoom = 12) %>% addTiles()  %>%
  addCircleMarkers(~Longitude, ~Latitude,  color = ~Color_Assets(Percent_SEP12_Assets),  popup = ~as.character(paste(Site, Percent_SEP12_Assets , sep=", "))) %>%
  addLegend("bottomright", pal = Color_Assets, values = Percent_SEP12_Assets, title = "SEP 12 Installs")
dput(sep)
structure(list(Site = structure(1:5, .Label = c("Staten Island\\31R001",
"Staten Island\\31R002", "Staten Island\\31R003", "Staten Island\\31R004",
"Staten Island\\31R005"), class = "factor"), Latitude = c(40.508874,
40.577256, 40.520825, 40.552373, 40.529697), Longitude = c(-74.244048,
-74.100135, -74.211845, -74.195516, -74.187532), Windows.SEP.11 = c(63L,
174L, 11L, 85L, 163L), Mac.SEP.11 = c(0L, 1L, 4L, 0L, 0L), Windows.SEP.12 = c(124L,
185L, 9L, 75L, 23L), Mac.SEP.12 = c(0L, 1L, 32L, 1L, 0L), newCol = c(66.3101604278075,
51.5235457063712, 73.2142857142857, 47.2049689440994, 12.3655913978495
)), .Names = c("Site", "Latitude", "Longitude", "Windows.SEP.11",
"Mac.SEP.11", "Windows.SEP.12", "Mac.SEP.12", "newCol"), row.names = c(NA,
-5L), class = "data.frame")
谢谢!
dput的作用是什么? - hrbrmstrvalues = Percent_SEP12_Assets。 - RhondacolorFactor有一个ordered参数... - hrbrmstrordered,即Color_Assets <- colorFactor(c("darkgreen","darkorange","darkred"), levels = Percent_SEP12_Assets, ordered=FALSE),但输出仍然相同。 - Rhonda