我认为你是正确的。像这个例子中所做的排序混淆了点的
x和
y坐标。它在这个例子中能够工作,更多或少是巧合。
我们有
x坐标
[1, -1, 1]和
y坐标
[1, -1, -1]。排序后它们变成了
[-1,1,1]和
[-1,-1,1],它们组成了与我们最初相同的三个对:
# original | sorted
# [ 1, -1] | [-1, -1]
# [-1, -1] | [ 1, -1]
# [ 1, 1] | [ 1, 1]
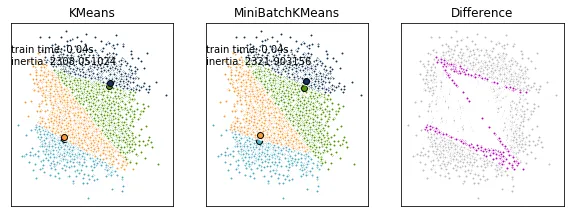
请看下方,当使用四个集群时会发生什么。在这种情况下,我们有:
# original | sorted
# [-1, -1] | [-1, -1]
# [-1, 1] | [-1, -1]
# [ 1, -1] | [ 1, 1]
# [ 1, 1] | [ 1, 1]
这些点是不同的。
修改后的示例代码:
print(__doc__)
import time
import numpy as np
import matplotlib.pyplot as plt
from sklearn.cluster import MiniBatchKMeans, KMeans
from sklearn.metrics.pairwise import pairwise_distances_argmin
from sklearn.datasets.samples_generator import make_blobs
np.random.seed(0)
batch_size = 45
centers = [[1, 1], [-1, -1], [1, -1], [-1, 1]]
n_clusters = len(centers)
X, labels_true = make_blobs(n_samples=3000, centers=centers, cluster_std=0.7)
k_means = KMeans(init='k-means++', n_clusters=4, n_init=10)
t0 = time.time()
k_means.fit(X)
t_batch = time.time() - t0
mbk = MiniBatchKMeans(init='k-means++', n_clusters=4, batch_size=batch_size,
n_init=10, max_no_improvement=10, verbose=0)
t0 = time.time()
mbk.fit(X)
t_mini_batch = time.time() - t0
fig = plt.figure(figsize=(8, 3))
fig.subplots_adjust(left=0.02, right=0.98, bottom=0.05, top=0.9)
colors = ['#4EACC5', '#FF9C34', '#4E9A06', '#123456']
k_means_cluster_centers = np.sort(k_means.cluster_centers_, axis=0)
mbk_means_cluster_centers = np.sort(mbk.cluster_centers_, axis=0)
k_means_labels = pairwise_distances_argmin(X, k_means_cluster_centers)
mbk_means_labels = pairwise_distances_argmin(X, mbk_means_cluster_centers)
order = pairwise_distances_argmin(k_means_cluster_centers,
mbk_means_cluster_centers)
ax = fig.add_subplot(1, 3, 1)
for k, col in zip(range(n_clusters), colors):
my_members = k_means_labels == k
cluster_center = k_means_cluster_centers[k]
ax.plot(X[my_members, 0], X[my_members, 1], 'w',
markerfacecolor=col, marker='.')
ax.plot(cluster_center[0], cluster_center[1], 'o', markerfacecolor=col,
markeredgecolor='k', markersize=6)
ax.set_title('KMeans')
ax.set_xticks(())
ax.set_yticks(())
plt.text(-3.5, 1.8, 'train time: %.2fs\ninertia: %f' % (
t_batch, k_means.inertia_))
ax = fig.add_subplot(1, 3, 2)
for k, col in zip(range(n_clusters), colors):
my_members = mbk_means_labels == order[k]
cluster_center = mbk_means_cluster_centers[order[k]]
ax.plot(X[my_members, 0], X[my_members, 1], 'w',
markerfacecolor=col, marker='.')
ax.plot(cluster_center[0], cluster_center[1], 'o', markerfacecolor=col,
markeredgecolor='k', markersize=6)
ax.set_title('MiniBatchKMeans')
ax.set_xticks(())
ax.set_yticks(())
plt.text(-3.5, 1.8, 'train time: %.2fs\ninertia: %f' %
(t_mini_batch, mbk.inertia_))
different = (mbk_means_labels == 4)
ax = fig.add_subplot(1, 3, 3)
for k in range(n_clusters):
different += ((k_means_labels == k) != (mbk_means_labels == order[k]))
identic = np.logical_not(different)
ax.plot(X[identic, 0], X[identic, 1], 'w',
markerfacecolor='#bbbbbb', marker='.')
ax.plot(X[different, 0], X[different, 1], 'w',
markerfacecolor='m', marker='.')
ax.set_title('Difference')
ax.set_xticks(())
ax.set_yticks(())
plt.show()
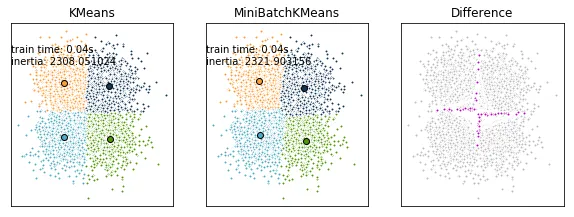
更合适的排序可能如下:
k_order = np.argsort(k_means.cluster_centers_[:, 0] + k_means.cluster_centers_[:, 1]*0.1)
mbk_order = np.argsort(mbk.cluster_centers_[:, 0] + mbk.cluster_centers_[:, 1]*0.1)
k_means_cluster_centers = k_means.cluster_centers_[k_order]
mbk_means_cluster_centers = mbk.cluster_centers_[mbk_order]
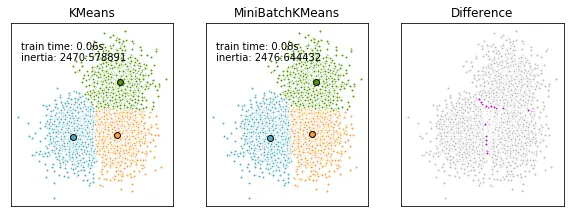
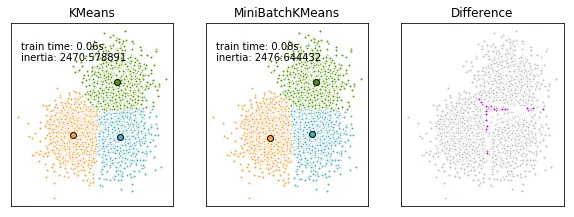
然而,正确的方法是先对齐聚类中心,然后强制执行(任意的)顺序。这应该可以完成工作:
mbk_order = pairwise_distances_argmin(k_means.cluster_centers_, mbk.cluster_centers_)
k_means_cluster_centers = k_means.cluster_centers_
mbk_means_cluster_centers = mbk.cluster_centers_[mbk_order]
np.sort。我偶然发现了这个帖子,因为我在尝试上面链接中概述的kmeans方法时得到了混淆的结果,并对np.sort产生了疑问。 - Johann