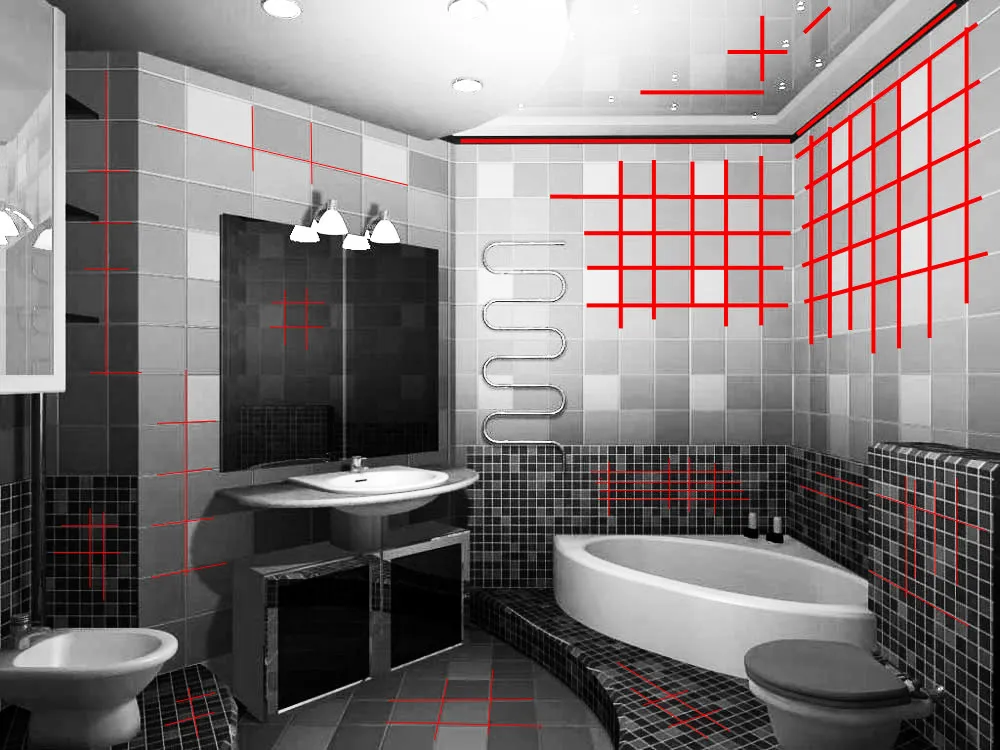
以下是应用霍夫变换来检测线条的完整示例。我使用MATLAB进行此操作。
诀窍在于将图像分成不同的区域并分别处理;这是因为您的场景中有不同的“纹理”(墙上较上方的瓷砖与底部较暗的瓷砖非常不同,同时处理整个图像并不是最优的方法)。
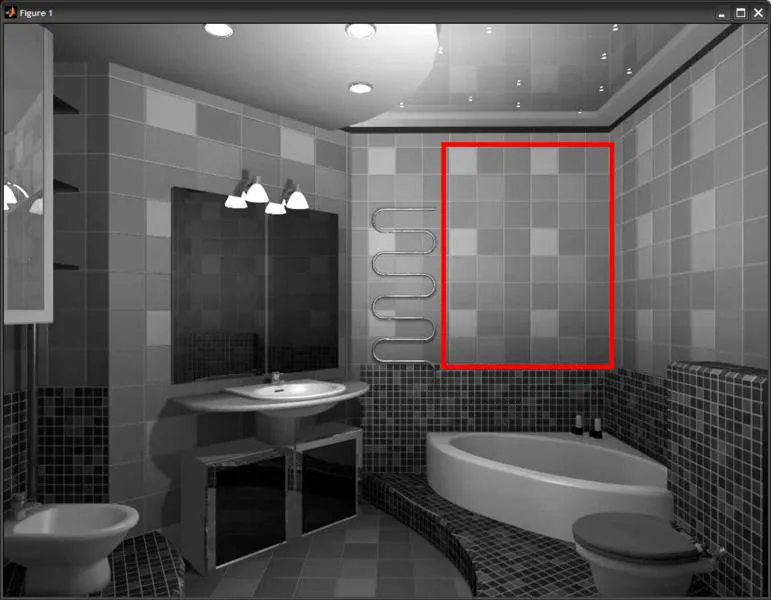
作为一个工作示例,考虑以下内容:
I0 = rgb2gray( imread('http://www.de-viz.ru/catalog/new2/Holm/hvannaya.jpg') );
I = imcrop(I0, [577 156 220 292]);
I = imfilter(I, fspecial('gaussian', [7 7], 1), 'symmetric');
BW = edge(I, 'canny');
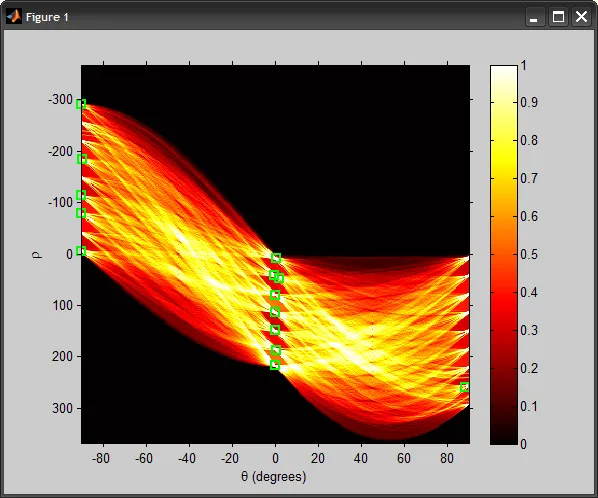
[H T R] = hough(BW, 'RhoResolution',2, 'Theta',-90:0.5:89.5);
imshow(imadjust(mat2gray(H)), [], 'XData',T, 'YData',R, ...
'InitialMagnification','fit')
xlabel('\theta (degrees)'), ylabel('\rho')
axis on, axis normal, colormap(hot), colorbar, hold on
P = houghpeaks(H, 20, 'threshold',ceil(0.5*max(H(:))));
plot(T(P(:,2)), R(P(:,1)), 'gs', 'LineWidth',2);
lines = houghlines(BW, T, R, P, 'FillGap',50, 'MinLength',5);
figure, imshow(I), hold on
for k = 1:length(lines)
xy = [lines(k).point1; lines(k).point2];
plot(xy(:,1), xy(:,2), 'g.-', 'LineWidth',2);
end
hold off
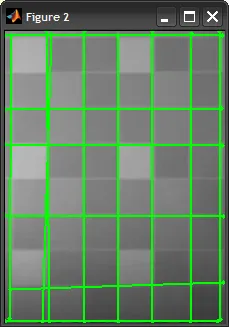
如果您想要获得良好的结果,可以尝试使用相同的流程来处理其他区域,并调整参数。