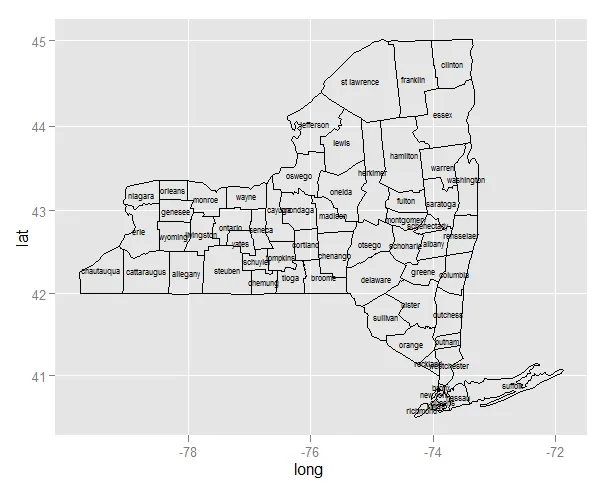
我试图使用ggplot2和maps绘制纽约州各县的名称。我的方法是找到每个县的纬度和经度的平均值(我假设这是该县的中心,但这可能是错误的想法),然后使用geom_text在地图上绘制名称。但它并没有按照我预期的那样运行,因为它在每个县中绘制了多个名称。
我希望每个文本(县)的中心都位于其相应县的中心位置。
除了解决问题外,我还希望能够理解我在使用ggplot时的错误思路。
提前感谢您的帮助。
我希望每个文本(县)的中心都位于其相应县的中心位置。
除了解决问题外,我还希望能够理解我在使用ggplot时的错误思路。
提前感谢您的帮助。
library(ggplot2); library(maps)

county_df <- map_data('county')  #mappings of counties by state
ny <- subset(county_df, region=="new york")   #subset just for NYS
ny$county <- ny$subregion
cnames <- aggregate(cbind(long, lat) ~ subregion, data=ny, FUN=mean)

p <- ggplot(ny, aes(long, lat, group=group)) +  geom_polygon(colour='black', fill=NA)
p #p of course plots as expected

#now add some county names (3 wrong attempts)
p + geom_text(aes(long, lat, data = cnames, label = subregion, size=.5)) #not correct

#I said maybe I'm confusing it with the same names for different data sets
names(cnames) <-c('sr', 'Lo', 'La')
p + geom_text(Lo, La, data = cnames, label = sr, aes(size=.5)) #attempt 2
p + geom_text(aes(Lo, La, data = cnames, label = sr, size=.5)) #attempt 3

cnames <- ddply(ia_pop, .(County, group), summarize, Centroid=centroid(cbind(long, lat)))然后像这样拆分Centroid列:cnames$long <- cnames$Centroid[,1]和cnames$lat <- cnames$Centroid[,2]- Danny