ggplot2如何使两个分面绘图的顶部对齐

4

我需要安排两个分面图,如下:

d = data.frame(Index = LETTERS[1:5],x=1:5,y=1:5)
A = ggplot(subset(d,Index == 'A'),aes(x,y)) + 
  theme_bw() + 
  theme(axis.title.x = element_blank()) + 
  geom_point() + facet_wrap(~Index) + labs(title = "Title, The Title", 
                                           subtitle = "Subtitle, The Subtitle",
                                           y = "Side Axes")
B = ggplot(subset(d,Index != 'A'),aes(x,y)) +
  theme_bw() + 
  theme(axis.title.x = element_blank(), axis.title.y = element_blank()) + 
  geom_point() + facet_wrap(~Index) + labs(title = "", subtitle = "")
g = gridExtra::arrangeGrob(A,B,ncol=2,bottom="Bottom Axes")
grid.arrange(g)

这将产生以下结果:

输出

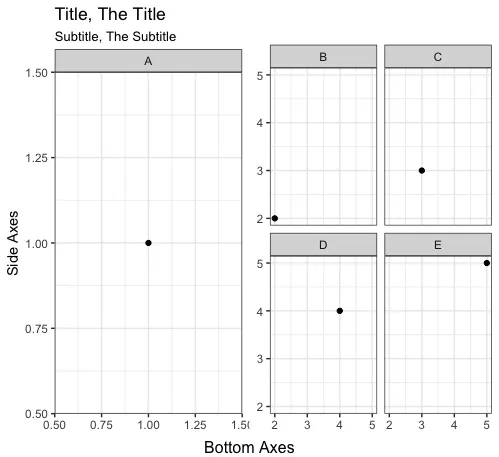
从上面可以看出,图形区域的顶部边缘存在轻微的不对齐。这是由标题和副标题中的“逗号”引起的。

有人知道我如何强制使顶部边缘对齐吗?我需要在左侧图形上有一个标题和副标题,并在右侧图形上有一个(空)标题和副标题。


设置边距,例如 theme(plot.margin = unit(c(.3, .2, .15, .2), 'cm')) - alistaire
3个回答

4

@CephBirk的解决方案是一个聪明又简单的方法。对于那些这样的hack不起作用的情况,您可以从您的绘图中移除标题和副标题,并创建单独的grobs,然后使用grid.arrangearrangeGrob将它们与绘图一起布局。在下面的代码中,我还添加了一个nullGrob()作为空格,位于绘图AB之间,以便左侧图表中正确的X标签(1.50)不被截断。

library(gridExtra)

A = ggplot(subset(d,Index == 'A'),aes(x,y)) + 
  theme_bw() + 
  theme(axis.title = element_blank()) + 
  geom_point() + facet_wrap(~Index) 

B = ggplot(subset(d,Index != 'A'),aes(x,y)) +
  theme_bw() + 
  theme(axis.title.x = element_blank(), axis.title.y = element_blank()) + 
  geom_point() + facet_wrap(~Index) 

grid.arrange(
  arrangeGrob(
    arrangeGrob(textGrob("Title, The Title", hjust=0), 
                textGrob("Subtitle, The Subtitle", hjust=0, gp=gpar(cex=0.8))),
    nullGrob(), ncol=2, widths=c(1,4)),
  arrangeGrob(A, nullGrob(), B, ncol=3, widths=c(8,0.1,8),
              left="Side Axes", bottom="Bottom Axes"), 
  heights=c(1,12))

enter image description here


这是完美的解决方案。谢谢。 - Nicholas Hamilton

2
egg::ggarrange(A, B, ncol=2, bottom="Bottom Axes")

enter image description here


谢谢。看起来确实非常有用! - Nicholas Hamilton

2

这个方法有点hackish,但是你可以在右侧和左侧拥有相同的标题和子标题,但是将其以白色字体打印出来。 :) 你说这是由于逗号引起的,所以这样就解决了。

虽然不是最令人满意的方法,但它可以完成工作。

B = ggplot(subset(d,Index != 'A'),aes(x,y)) +
theme_bw() + 
theme(axis.title.x = element_blank(), axis.title.y = element_blank(), title = element_text(color = 'white')) + 
geom_point() + facet_wrap(~Index) +
labs(title = "Title, The Title", subtitle = "Subtitle, The Subtitle")

另一个选择是使用 labs(title = expression(phantom("Title, The Title")), subtitle = expression(phantom("Subtitle, The Subtitle")))(对于A也使用 expression(),但不使用 phantom())。 - baptiste

网页内容由stack overflow 提供, 点击上面的
可以查看英文原文,
原文链接