PyMC3变点回归

4

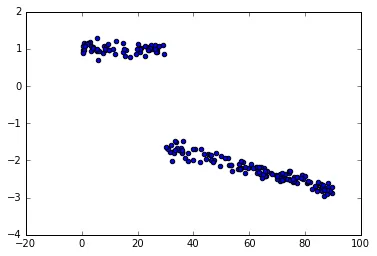
我看过使用pymc3进行变点分析的示例,但似乎我遗漏了什么,因为我得到的结果与真实值相差甚远。这是一个玩具示例。

数据:

toy data

脚本:

from pymc3 import *
from numpy.random import uniform, normal

bp_u = 30 #switch point
c_u = [1, -1] #intercepts before and after switch point
beta_u = [0, -0.02]  #slopes before & after switch point

x = uniform(0,90, 200)

y = (x < bp_u)*(c_u[0]+beta_u[0]*x) + (x >= bp_u)*(c_u[1]+beta_u[1]*x) + normal(0,0.1,200)

with Model() as sw_model:

    sigma = HalfCauchy('sigma', beta=10, testval=1.)

    switchpoint = Uniform('switchpoint', lower=x.min(), upper=x.max(), testval=45)

    # Priors for pre- and post-switch intercepts and slopes
    intercept_u1 = Uniform('Intercept_u1', lower=-10, upper=10)
    intercept_u2 = Uniform('Intercept_u2', lower=-10, upper=10)
    x_coeff_u1 = Normal('x_u1', 0, sd=20)
    x_coeff_u2 = Normal('x_u2', 0, sd=20)

    intercept = switch(switchpoint < x, intercept_u1, intercept_u2)
    x_coeff = switch(switchpoint < x, x_coeff_u1, x_coeff_u2)

    likelihood = Normal('y', mu=intercept + x_coeff * x, sd=sigma, observed=y)

    start = find_MAP() 

with sw_model:
    step1 = NUTS([intercept_u1, intercept_u2, x_coeff_u1, x_coeff_u2])
    step2 = NUTS([switchpoint])

    trace = sample(2000, step=[step1, step2], start=start, progressbar=True)
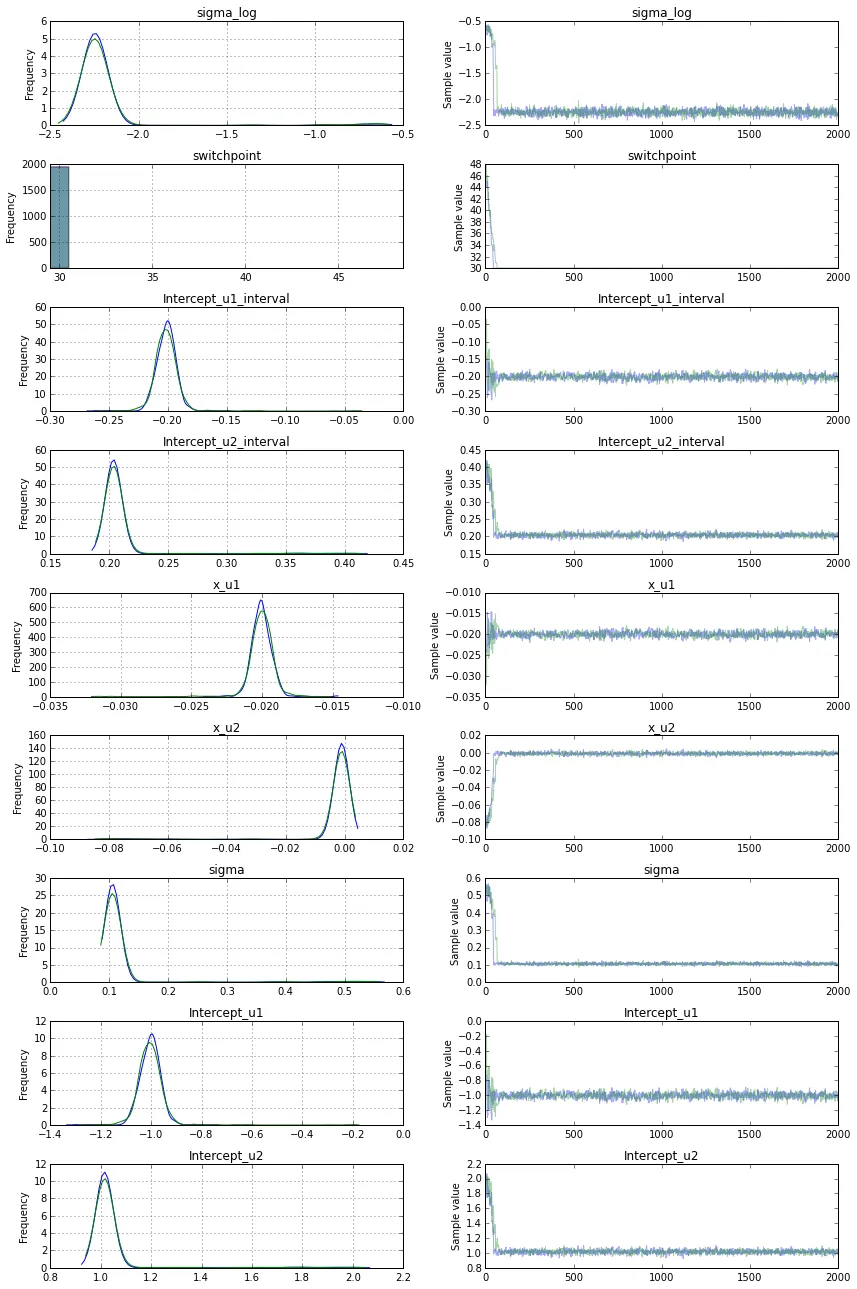
这里是结果:

segmented regression results

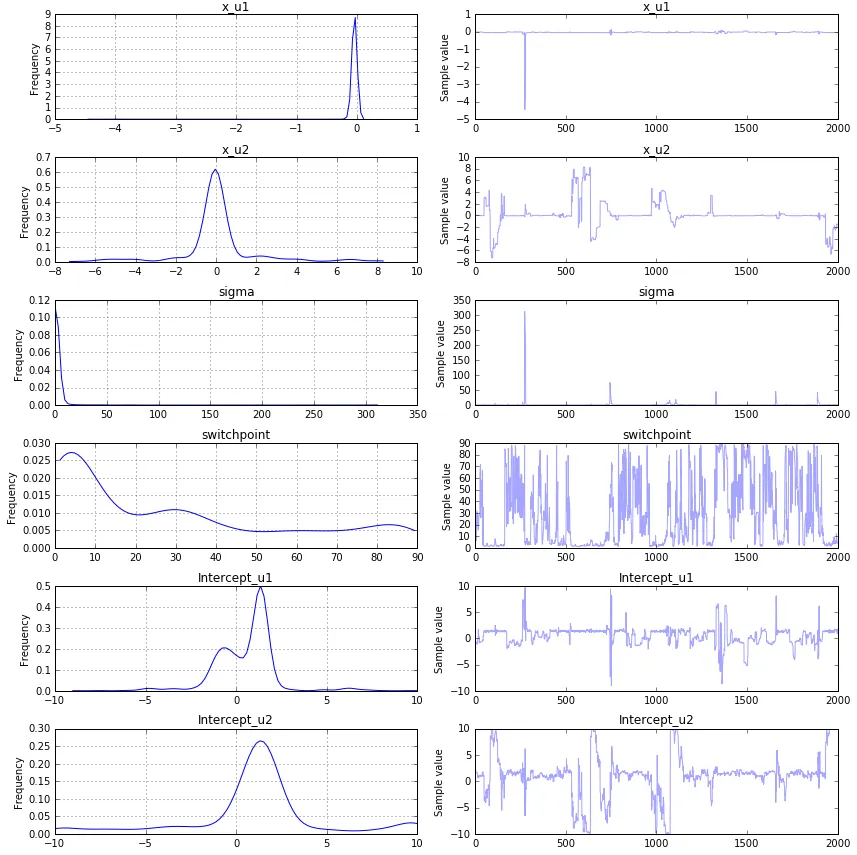
正如您所看到的,它们与初始值非常不同。我做错了什么?


如果您将sigma设置为一个小的固定数字(例如0.01),则会得到合理的结果。我实际上不明白代码为什么不能自行确定这一点。 - inversion
这是我将sigma设置为0.01时得到的结果。http://imgur.com/2Q6TsNJ - inversion
谢谢!那很有帮助。但最终我转而使用Metropolis采样的离散断点,这也极大地提高了速度和准确性。 - Andrey Chetverikov
1
如果您愿意使用R语言解决问题,可以使用mcp包进行建模,代码为fit = mcp(list(y ~ 1, ~ 1 + x), data)。使用plot_pars(fit)函数绘制后验分布和追踪图。 - Jonas Lindeløv
@JonasLindeløv,谢谢,我现在不需要了,但知道R解决方案很好。 - Andrey Chetverikov
1个回答

10

最终看起来,使用离散断点和Metropolis采样切换解决了这个问题。以下是最终模型:

with Model() as sw_model:

    sigma = HalfCauchy('sigma', beta=10, testval=1.)

    switchpoint = DiscreteUniform('switchpoint', lower=0, upper=90, testval=45)

    # Priors for pre- and post-switch intercepts and slopes
    intercept_u1 = Uniform('Intercept_u1', lower=-10, upper=10, testval = 0)
    intercept_u2 = Uniform('Intercept_u2', lower=-10, upper=10, testval = 0)
    x_coeff_u1 = Normal('x_u1', 0, sd=20)
    x_coeff_u2 = Normal('x_u2', 0, sd=20)

    intercept = switch(switchpoint < x, intercept_u1, intercept_u2)
    x_coeff = switch(switchpoint < x, x_coeff_u1, x_coeff_u2)

    likelihood = Normal('y', mu=intercept + x_coeff * x, sd=sigma, observed=y)

    start = find_MAP() 

    step1 = NUTS([intercept_u1, intercept_u2, x_coeff_u1, x_coeff_u2])
    step2 = Metropolis([switchpoint])

    trace = sample(20000, step=[step1, step2], start=start, njobs=4,progressbar=True)

the traceplot


2
从记忆中来看,NUTS 假设似然函数连续(和可微分?):断点引入不连续性,因此 Metropolis 可以工作,但 NUTS 不能。 - carlosayam
感谢您发布并跟进此事。我想知道您是否可以更新此内容,以查看如何使用最新版本的pymc3和az.plot_trace以及return_inferencedata=True发布结果。 - John Stud

网页内容由stack overflow 提供, 点击上面的
可以查看英文原文,
原文链接