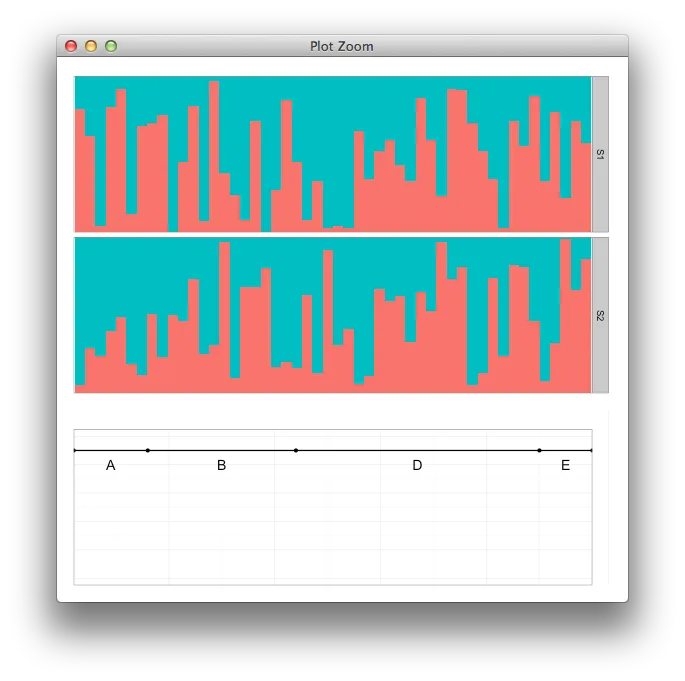
我正在尝试将n个条形图与一个共同的标签绘图组合在一起。我的问题是grid.arrange将两个图表组合成50%-50%。我正在寻找像布局矩阵这样的东西,您可以在其中指定4个插槽,前3个被第一个图占用,最后一个插槽被第二个图占用。并根据绘图数量进行类似的自定义。下面是我正在尝试的示例代码:
两个图表并不完全对齐,但这是另一个问题。这很有用。 如何使用grid.arrange排列任意数量的ggplots? 我可以逐个绘制每个图形,但我想要有facet标签。
#load libraries
require(ggplot2)
require(reshape)
require(grid)
require(gridExtra)

#data creation
#DATA
temp<-data.frame(var1=sample(0:100,100,replace=T))
temp$var2<-100-temp$var1
temp$type<-factor(c(rep("S1",50),rep("S2",50)))
temp$label<-factor(rep(1:50,2))
temp1<-melt(temp,id.var=c("type","label"))
#LABELS
labs1<-data.frame(pos=c(1,8,22,45,50))
labs2<-data.frame(pos1=round((diff(labs1$pos)/2)+labs1$pos[1:length(labs1$pos)-1],1),
         lab=c("A","B","D","E"))

#plots
plot1<-ggplot(data=temp1)+
geom_bar(aes(x=label,y=value,fill=variable),stat="identity",space=0,width=1)+
facet_grid(type~.)+theme_bw()+labs(x=NULL,y=NULL)+
scale_y_continuous(expand=c(0,0))+
theme(legend.position="none",axis.text=element_blank(),axis.ticks=element_blank())
plot2<-ggplot()+
geom_line(data=labs1,aes(x=pos,y=-0.05),size=0.6)+
geom_point(data=labs1,aes(x=pos,y=-0.05))+labs(x=NULL,y=NULL)+
geom_text(data=labs2,aes(x=pos1,y=-0.1,label=lab))+
theme_bw()+scale_x_continuous(expand=c(0,0))+scale_y_continuous(limit=c(-0.5,0))+
theme(legend.position="none",axis.text=element_blank(),axis.ticks=element_blank())

plot3<-grid.arrange(plot1, plot2)
#here perhaps there is a way to say plot1 to take up 1/3 of the plot area.
两个图表并不完全对齐,但这是另一个问题。这很有用。 如何使用grid.arrange排列任意数量的ggplots? 我可以逐个绘制每个图形,但我想要有facet标签。
labs2<- data.frame(pos1<- round...中,没有lab$pos。此外,我认为你想要的是pos1= round(...而不是pos1<- round(...。 - jlhoward