我试图使用自定义比例尺/轴变换,如下:
library(ggplot2)
library(scales)
dat <- data.frame(
time.tot = c(407.17, 168.83, 127.8, 108.88, 69.04, 68.5, 59.76, 407.17,
168.83, 127.8, 108.88, 69.04, 68.5, 59.76, 407.17, 168.83, 127.8,
108.88, 69.04, 68.5, 59.76),
error = c(0, 0.01, 0.05, 0.1, 0.5, 0.7, 1, 1.91e-06, 0.00229, 0.00884,
0.0172, 0.128, 0.128, 0.22, 1.43e-08, 0.000337, 0.00121, 0.00221,
0.0123, 0.0123, 0.0213, 0, 0.01, 0.05, 0.1, 0.5, 0.7, 1, 1.91e-06,
0.00229, 0.00884, 0.0172, 0.128, 0.128, 0.22, 1.43e-08, 0.000337,
0.00121, 0.00221, 0.0123, 0.0123, 0.0213),
type = rep(c("A", "B", "C"), each=7))
eps <- 1e-8
tn <- trans_new("logpeps",
function(x) log(x+eps),
function(y) exp(y)-eps,
domain=c(0, Inf),
breaks=c(0, 0.1, 1))
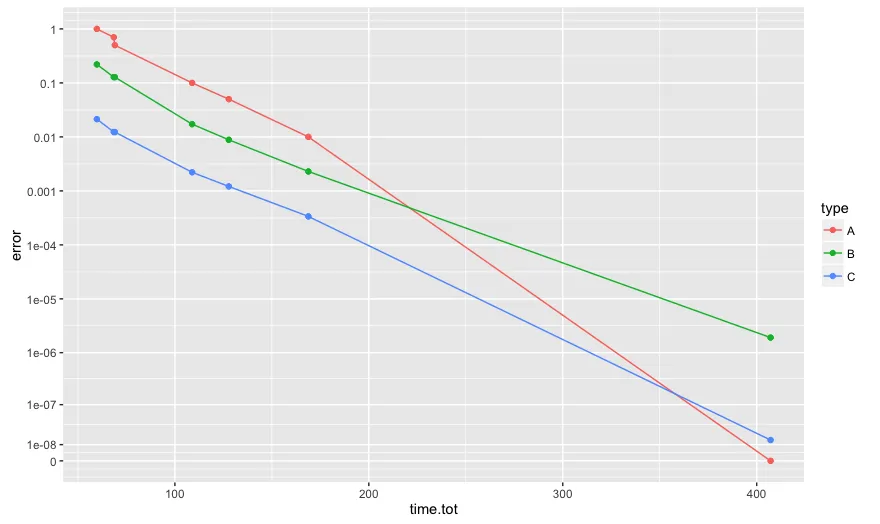
ggplot(dat, aes(x=time.tot, y=error, color=type)) +
geom_line() + geom_point() + coord_trans(y = tn)
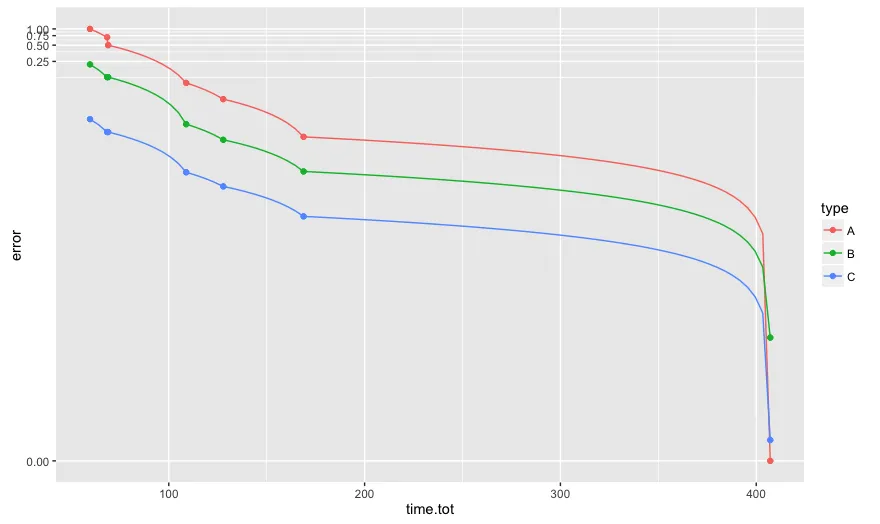
我还想知道如何/是否“修复”曲线 - 看起来它们是在原始比例尺上绘制,然后在使用我的自定义tn后进行转换。