使用pandas python将嵌套的JSON解析为多个数据框。

3
我有一个嵌套的JSON,如下所示,并希望在Python中解析成多个数据框架..请帮忙。
{
"tableName": "cases",
"url": "EndpointVoid",
"tableDataList": [{
    "_id": "100017252700",
    "title": "Test",
    "type": "TECH",
    "created": "2016-09-06T19:00:17.071Z",
    "createdBy": "193164275",
    "lastModified": "2016-10-04T21:50:49.539Z",
    "lastModifiedBy": "1074113719",
    "notes": [{
        "id": "30",
        "title": "Multiple devices",
        "type": "INCCL",
        "origin": "D",
        "componentCode": "PD17A",
        "issueCode": "IP321",
        "affectedProduct": "134322",
        "summary": "testing the json",

        "caller": {
            "email": "katie.slabiak@spps.org",
            "phone": "651-744-4522"
        }
    }, {
        "id": "50",
        "title": "EDU: Multiple Devices - Lightning-to-USB Cable",
        "type": "INCCL",
        "origin": "D",
        "componentCode": "PD17A",
        "issueCode": "IP321",
        "affectedProduct": "134322",
        "summary": "parsing json 2",
        "caller": {
            "email": "testing1@test.org",
            "phone": "123-345-1111"
        }
    }],
    "syncCount": 2316,
    "repair": [{
            "id": "D208491610",
            "created": "2016-09-06T19:02:48.000Z",
            "createdBy": "193164275",
            "lastModified": "2016-09-21T12:49:47.000Z"
        }, {
            "id": "D208491610"
        }, {
            "id": "D208491628",
            "created": "2016-09-06T19:03:37.000Z",
            "createdBy": "193164275",
            "lastModified": "2016-09-21T12:49:47.000Z"
        }

    ],
    "enterpriseStatus": "8"
}],
"dateTime": 1475617849,
"primaryKeys": ["$._id"],
"primaryKeyVals": ["100017252700"],
"operation": "UPDATE"

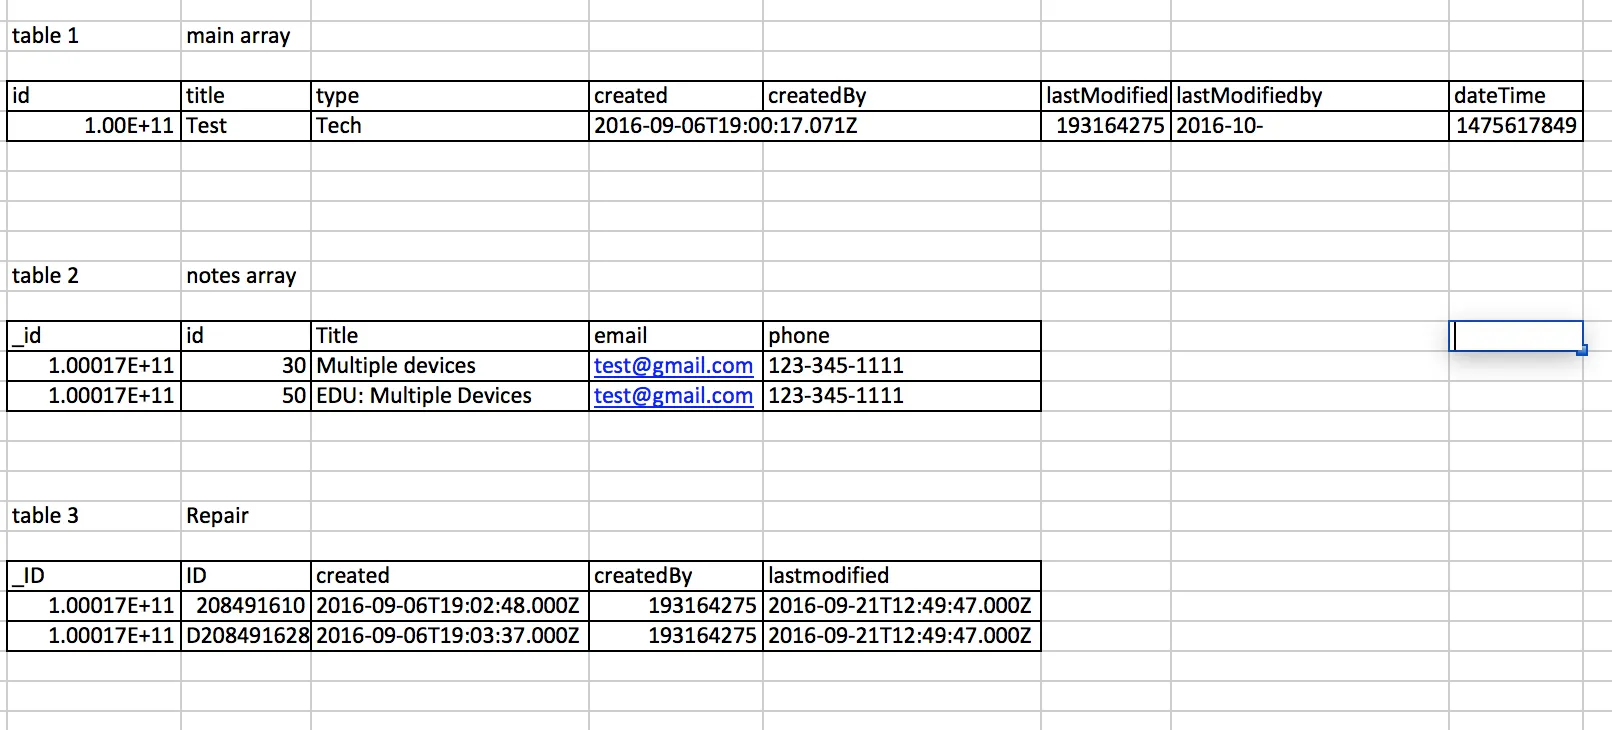
我希望解析这个并创建如下三个表/数据框/CSV。。请帮忙。

输出表格格式如上图


我认为你的 JSON 不是有效的,请访问 http://jsonlint.com/ 进行检查。 - jezrael
感谢jezrael提醒我,这是复制粘贴错误。我已经修复了JSON文件。 - Raj
1个回答

1

我不认为这是最好的方法,但我想向您展示可能性。

import pandas as pd
from pandas.io.json import json_normalize
import json

with open('your_sample.json') as f:    
    dt = json.load(f)

表格1

df1 = json_normalize(dt, 'tableDataList', 'dateTime')[['_id', 'title', 'type', 'created', 'createdBy', 'lastModified', 'lastModifiedBy', 'dateTime']]
print df1


            _id title  type                   created  createdBy  \
0  100017252700  Test  TECH  2016-09-06T19:00:17.071Z  193164275   

               lastModified lastModifiedBy    dateTime  
0  2016-10-04T21:50:49.539Z     1074113719  1475617849  

表2
df2 = json_normalize(dt['tableDataList'], 'notes', '_id')
df2['phone'] = df2['caller'].map(lambda x: x['phone'])
df2['email'] = df2['caller'].map(lambda x: x['email'])
df2 = df2[['_id', 'id', 'title', 'email', 'phone']]
print df2


            _id  id                                           title  \
0  100017252700  30                                Multiple devices   
1  100017252700  50  EDU: Multiple Devices - Lightning-to-USB Cable   

                    email         phone  
0  katie.slabiak@spps.org  651-744-4522  
1       testing1@test.org  123-345-1111  

表格 3

df3 = json_normalize(dt['tableDataList'], 'repair', '_id').dropna()
print df3


                    created  createdBy          id              lastModified  \
0  2016-09-06T19:02:48.000Z  193164275  D208491610  2016-09-21T12:49:47.000Z   
2  2016-09-06T19:03:37.000Z  193164275  D208491628  2016-09-21T12:49:47.000Z   

            _id  
0  100017252700  
2  100017252700  

这段代码是有效的。基本上,我正在从MongoDB导出JSON格式的数据,但如果我获取到多个案例记录,代码就会出现问题,有时候一些列在JSON中没有填充,再次遇到了JSON索引不可用的问题。 - Raj

网页内容由stack overflow 提供, 点击上面的
可以查看英文原文,
原文链接