从箱线图中提取统计数据

3

我已经尝试搜索,但没有找到类似的内容。 我有一个包含温度的数据集,另一个数据集包含23种地形(分类变量)。 我已经绘制了温度与地形类型之间的数据集,看到了这个图中的趋势,现在我想从这个图中提取统计信息(例如中位数)。

这是我用于绘制箱线图的代码:

boxplot(zone$tm_03 ~ ds3_utm$terr, col='chartreuse3', xlab='Terreno', ylab='Temperatura (°C)', varwidth=T)

这是我找到的箱线图:

Boxplot

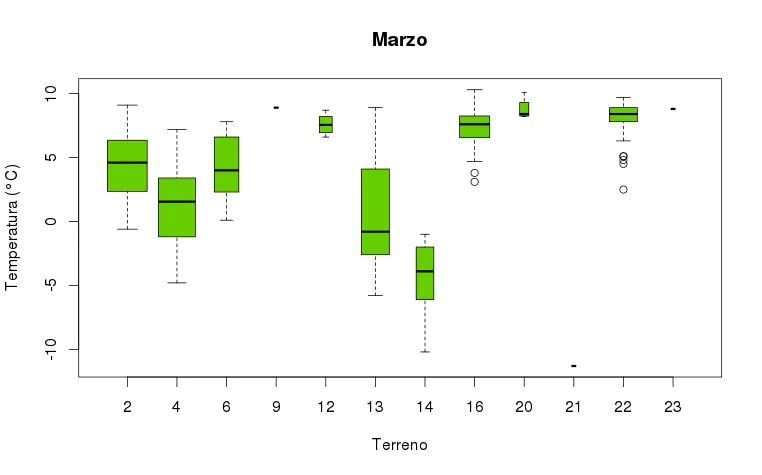
我想从箱线图中提取每个类别的中位数值。我考虑使用boxplot.stats(),但我未能使其正常工作。

boxplot_stats<-boxplot.stats(zone$tm_01 ~ ds3$terr)
Error in x[floor(d)] + x[ceiling(d)] : 
  non numeric argument transformed in binary operator
Inoltre: Warning messages:
1: In is.na(x) :
is.na() applied to non-(list or vector) of type 'language'
2: In is.na(x) :
is.na() applied to non-(list or vector) of type 'language'
3: In is.na(x) :
is.na() applied to non-(list or vector) of type 'language'

summary() 方法:

> summary(boxplot(zone$tm_03 ~ ds3_utm$terr, col='chartreuse3', xlab='Terreno', ylab='Temperatura (°C)', main='Marzo', varwidth=T))
Errore in summary(boxplot(zone$tm_03 ~ ds3_utm$terr, col = "chartreuse3",  : 
  error in evaluating the argument 'object' in selecting a method for     function 'summary': Errore in eval(expr, envir, enclos) : oggetto "ds3_utm" not found.

有人能帮我吗?

先谢过了!


有时候,阅读函数的帮助文档可以...有所帮助。在您的情况下,请查看“值”部分... - Cath
1
在提问之前,我已经阅读了函数参考文档,只是没有理解。如果我没有阅读,我甚至无法绘制箱线图。 - Eugen
将来如果您需要类似的内容并帮助您更好地理解函数的帮助文档:帮助文档中的“值”部分告诉您函数(我们称之为anyfunc)返回的内容。换句话说,它描述了当您执行 result<-anyfunc(...) 时所得到的对象(我们称之为result)。 - Cath
谢谢,我不知道,我会记住的。我想我只需要一个关于如何阅读参考文献的解释 :) - Eugen
2个回答

9
尝试以下步骤:
res <-  boxplot(len ~ dose, data = ToothGrowth)
res

提供:

$stats
      [,1]  [,2]  [,3]
[1,]  4.20 13.60 18.50
[2,]  7.15 16.00 23.45
[3,]  9.85 19.25 25.95
[4,] 13.00 23.45 28.35
[5,] 21.50 27.30 33.90

$n
[1] 20 20 20

$conf
          [,1]     [,2]     [,3]
[1,]  7.783202 16.61792 24.21884
[2,] 11.916798 21.88208 27.68116

$out
numeric(0)

$group
numeric(0)

$names
[1] "0.5" "1"   "2"  

谢谢,你的答案解决了我的问题。看到一个例子后,我明白了引用是什么意思;) - Eugen

9

来自boxplot帮助文档:

列表,包含以下组成部分:

stats
一个矩阵,每一列都包含一个组/图的下须子极限、下四分位数、中位数、上四分位数和上须子极限的极值。如果所有输入具有相同的类属性,则此组件也是如此。

n
一个向量,其中包含每个组中的观察次数。

conf
一个矩阵,每一列都包含缺口的下部和上部的极值。

out
落在须子极限以外的任何数据点的值。

group
与out长度相同的向量,其元素指示离群值所属的组。

names
组的名称向量。

因此,在您的情况下,您可以通过以下方式获取不同类别的中位数:

# drawing the boxplots and assigning the results to an object
bp<-boxplot(zone$tm_03 ~ ds3_utm$terr, col='chartreuse3', xlab='Terreno', ylab='Temperatura (°C)', varwidth=T)
# get the different medians, which are on the 3rd row of the stats element
bp$stats[3,]

网页内容由stack overflow 提供, 点击上面的
可以查看英文原文,
原文链接