我已经在这里回答了这个问题,但下面是一个快速的函数,可以使用rpy2在Python中使用R的稳健统计分解与loess。
import pandas as pd
from rpy2.robjects import r, pandas2ri
import numpy as np
from rpy2.robjects.packages import importr
def decompose(series, frequency, s_window = 'periodic', log = False, **kwargs):
'''
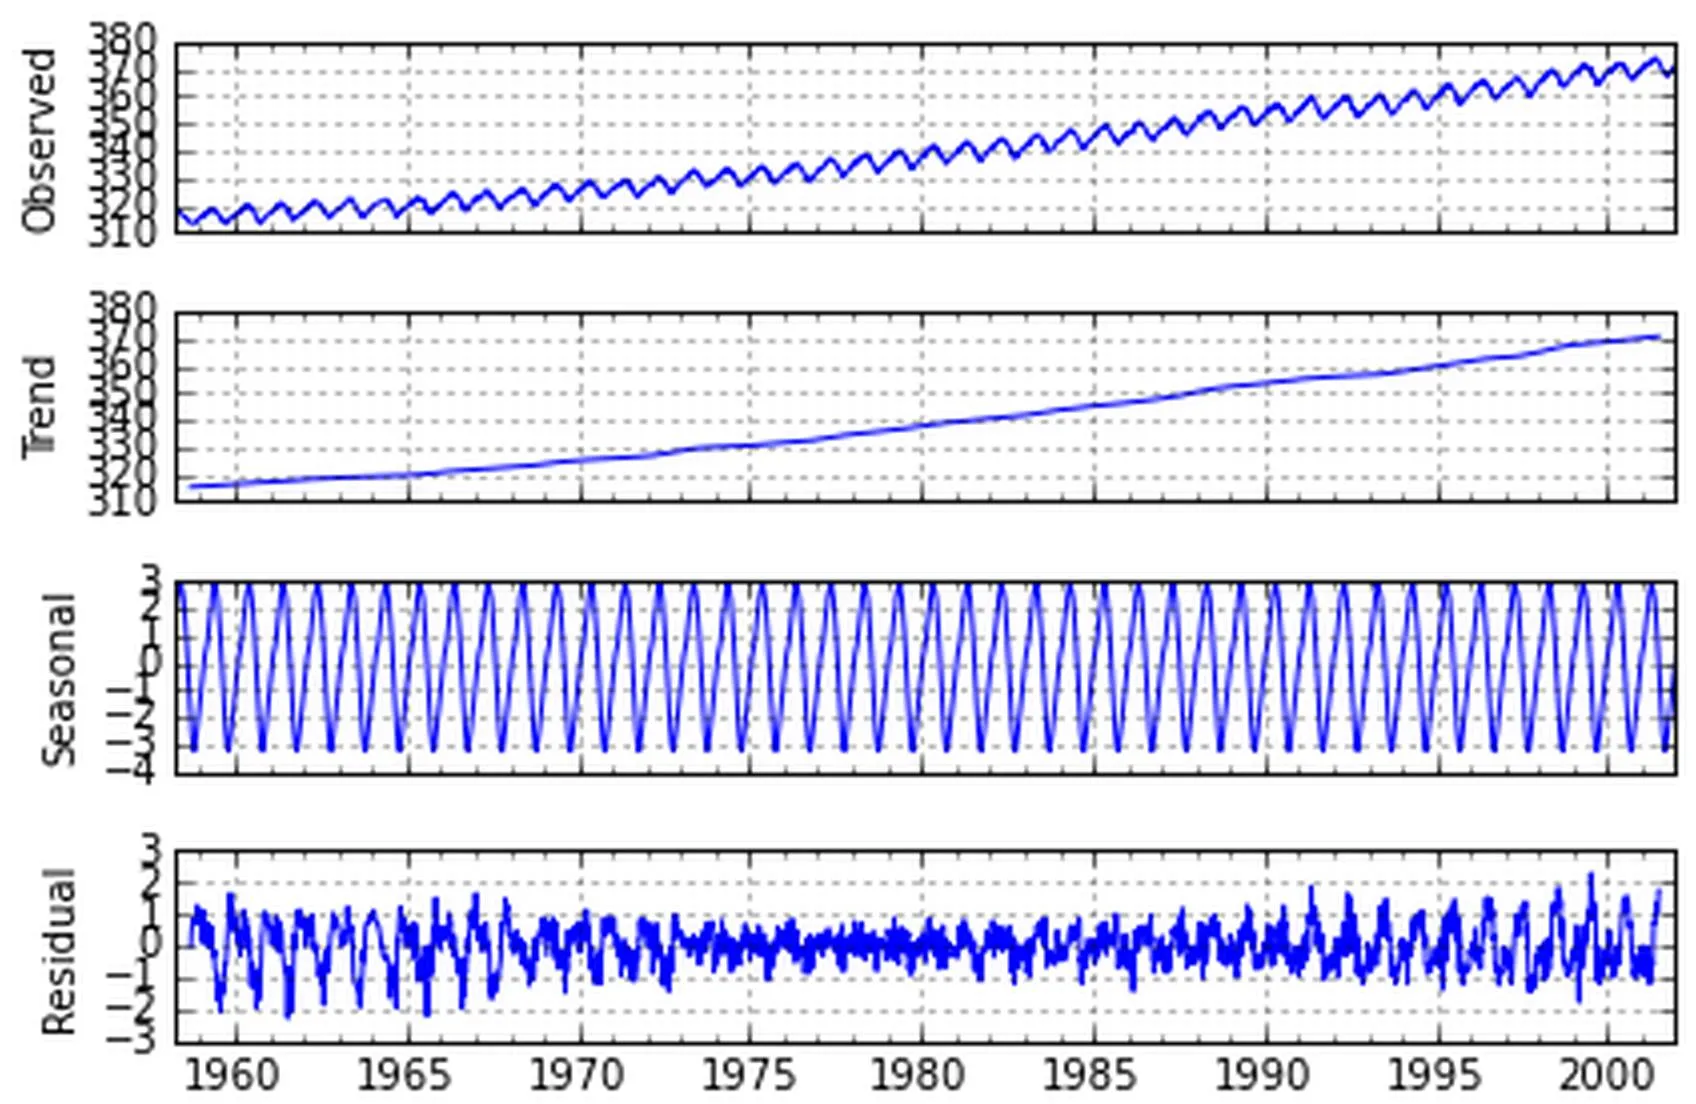
Decompose a time series into seasonal, trend and irregular components using loess,
acronym STL.
https://www.rdocumentation.org/packages/stats/versions/3.4.3/topics/stl
params:
series: a time series
frequency: the number of observations per “cycle”
(normally a year, but sometimes a week, a day or an hour)
https://robjhyndman.com/hyndsight/seasonal-periods/
s_window: either the character string "periodic" or the span
(in lags) of the loess window for seasonal extraction,
which should be odd and at least 7, according to Cleveland
et al.
log: boolean. take log of series
**kwargs: See other params for stl at
https://www.rdocumentation.org/packages/stats/versions/3.4.3/topics/stl
'''
df = pd.DataFrame()
df['date'] = series.index
if log: series = series.pipe(np.log)
s = [x for x in series.values]
length = len(series)
s = r.ts(s, frequency=frequency)
decomposed = [x for x in r.stl(s, s_window).rx2('time.series')]
df['observed'] = series.values
df['trend'] = decomposed[length:2*length]
df['seasonal'] = decomposed[0:length]
df['residuals'] = decomposed[2*length:3*length]
return df
以上函数假定您的时间序列具有日期时间索引。它返回一个包含各个组件的数据框,您可以使用您喜欢的绘图库来绘制它们。
您可以传递stl参数,在此处查看,但将任何周期更改为下划线,例如上面函数中的位置参数是s_window,但在上面链接中它是s.window。此外,我在这个存储库中找到了一些上面的代码。
示例数据
希望以下数据有效,老实说我自己没有试过,因为这是我回答问题之后很久的一个请求。
import pandas as pd
import numpy as np
obs_per_cycle = 52
observations = obs_per_cycle * 3
data = [v+2*i for i,v in enumerate(np.random.normal(5, 1, observations))]
tidx = pd.date_range('2016-07-01', periods=observations, freq='w')
ts = pd.Series(data=data, index=tidx)
df = decompose(ts, frequency=obs_per_cycle, s_window = 'periodic')