如何为ggplot2图例格式化数字值?

31

我正在完成使用ggplot2生成的图形,就像这样...

ggplot(timeSeries, aes(x=Date, y=Unique.Visitors, colour=Revenue)) 
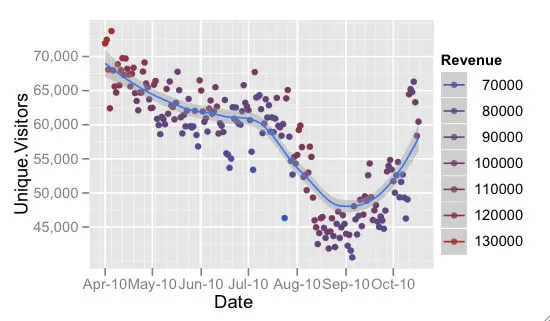
+ geom_point() + stat_smooth() + scale_y_continuous(formatter=comma)

我已经附上了结果,您可以看到收入图例中的数字值没有逗号。如何在这些值中添加逗号?我能够使用scale_y_continuous来调整坐标轴,那么是否也可以用于图例?

alt text

4个回答

62

为了保持最新,ggplot2_0.9.3 的工作语法如下:

require(scales)
ggplot(timeSeries, aes(x=Date, y=Unique.Visitors, colour=Revenue)) +
    geom_point() +
    stat_smooth() +
    scale_y_continuous(labels=comma) +
    scale_colour_continuous(labels=comma)

还可以参考这个交换


如果您在aes()中设置了size(而不是colour),那么请使用scale_size_continuous(labels = comma),类似地,对于形状和填充也是如此。 - PatrickT

14

注意2014-07-16:这个答案中的语法已经过时。使用metasequoia的答案!


是的 - 只需要找出正确的scale_colour_层即可。请尝试:

ggplot(timeSeries, aes(x = Date, y = Unique.Visitors, colour = Revenue)) +
    geom_point() +
    stat_smooth() +
    scale_y_continuous(formatter = comma) +
    scale_colour_continuous(formatter = comma)

个人而言,我会将颜色映射移到geom_point层,以便在图例中的点后面不出现奇怪的线条:

ggplot(timeSeries, aes(x = Date, y = Unique.Visitors)) +
    geom_point(aes(colour = Revenue)) +
    stat_smooth() +
    scale_y_continuous(formatter = comma) +
    scale_colour_continuous(formatter = comma)

8

当我偶然发现这个旧帖子时,也许值得补充的是你需要加载library("scales"),否则你会收到以下错误信息:

Error in check_breaks_labels(breaks, labels) : object 'comma' not found


1
需要重新安装“scales”包并手动加载它才能使此解决方案起作用。 - Martin Boros
您可以通过使用 scale_y_continuous(labels=scales::comma) 来解决这个问题。 - janverkade

1
请注意,commacomma_format()已被label_comma()取代。以下是我通常使用的方法:
... + 
scale_y_continuous(labels = scales::label_comma()) +
scale_colour_continuous(labels = scales::label_comma()) 

网页内容由stack overflow 提供, 点击上面的
可以查看英文原文,
原文链接