2个回答
16
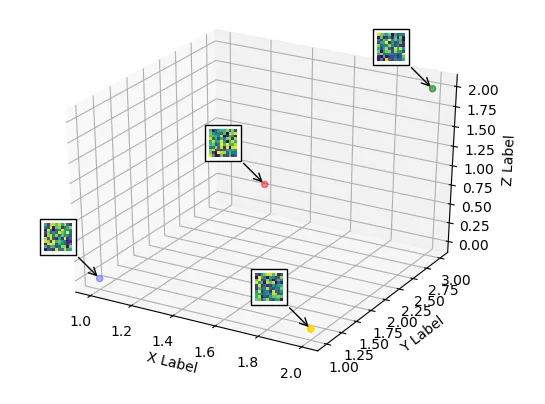
matplotlib.offsetbox在3D中不起作用。作为一种解决方法,可以使用一个2D轴覆盖在3D图上,并将图像注释放置在该2D轴的位置,该位置对应于3D轴上的位置。
要计算这些位置的坐标,可以参考如何使用matplotlib将3D数据单位转换为显示单位?。然后,可以使用这些显示坐标的反变换来获得叠加轴上的新坐标。
from mpl_toolkits.mplot3d import Axes3D
from mpl_toolkits.mplot3d import proj3d
import matplotlib.pyplot as plt
from matplotlib import offsetbox
import numpy as np

xs = [1,1.5,2,2]
ys = [1,2,3,1]
zs = [0,1,2,0]

c = ["b","r","g","gold"]

fig = plt.figure()
ax = fig.add_subplot(111, projection=Axes3D.name)

ax.scatter(xs, ys, zs, c=c, marker="o")

# Create a dummy axes to place annotations to
ax2 = fig.add_subplot(111,frame_on=False)
ax2.axis("off")
ax2.axis([0,1,0,1])


def proj(X, ax1, ax2):
    """ From a 3D point in axes ax1,
        calculate position in 2D in ax2 """
    x,y,z = X
    x2, y2, _ = proj3d.proj_transform(x,y,z, ax1.get_proj())
    return ax2.transData.inverted().transform(ax1.transData.transform((x2, y2)))

def image(ax,arr,xy):
    """ Place an image (arr) as annotation at position xy """
    im = offsetbox.OffsetImage(arr, zoom=2)
    im.image.axes = ax
    ab = offsetbox.AnnotationBbox(im, xy, xybox=(-30., 30.),
                        xycoords='data', boxcoords="offset points",
                        pad=0.3, arrowprops=dict(arrowstyle="->"))
    ax.add_artist(ab)


for s in zip(xs,ys,zs):
    x,y = proj(s, ax, ax2)
    image(ax2,np.random.rand(10,10),[x,y])

ax.set_xlabel('X Label')
ax.set_ylabel('Y Label')
ax.set_zlabel('Z Label')
plt.show()
上述解决方案是静态的,这意味着如果绘图被旋转或缩放,注释将不再指向正确的位置。为了同步注释,可以连接到绘制事件,并检查限制或观察角度是否已更改,并相应地更新注释坐标。(2019年的编辑: 新版本还需要将事件从顶部2D轴传递到底部3D轴; 代码已更新)
from mpl_toolkits.mplot3d import Axes3D
from mpl_toolkits.mplot3d import proj3d
import matplotlib.pyplot as plt
from matplotlib import offsetbox
import numpy as np

xs = [1,1.5,2,2]
ys = [1,2,3,1]
zs = [0,1,2,0]
c = ["b","r","g","gold"]


fig = plt.figure()
ax = fig.add_subplot(111, projection=Axes3D.name)

ax.scatter(xs, ys, zs, c=c, marker="o")

# Create a dummy axes to place annotations to
ax2 = fig.add_subplot(111,frame_on=False)
ax2.axis("off")
ax2.axis([0,1,0,1])

class ImageAnnotations3D():
    def __init__(self, xyz, imgs, ax3d,ax2d):
        self.xyz = xyz
        self.imgs = imgs
        self.ax3d = ax3d
        self.ax2d = ax2d
        self.annot = []
        for s,im in zip(self.xyz, self.imgs):
            x,y = self.proj(s)
            self.annot.append(self.image(im,[x,y]))
        self.lim = self.ax3d.get_w_lims()
        self.rot = self.ax3d.get_proj()
        self.cid = self.ax3d.figure.canvas.mpl_connect("draw_event",self.update)

        self.funcmap = {"button_press_event" : self.ax3d._button_press,
                        "motion_notify_event" : self.ax3d._on_move,
                        "button_release_event" : self.ax3d._button_release}

        self.cfs = [self.ax3d.figure.canvas.mpl_connect(kind, self.cb) \
                        for kind in self.funcmap.keys()]

    def cb(self, event):
        event.inaxes = self.ax3d
        self.funcmap[event.name](event)

    def proj(self, X):
        """ From a 3D point in axes ax1,
            calculate position in 2D in ax2 """
        x,y,z = X
        x2, y2, _ = proj3d.proj_transform(x,y,z, self.ax3d.get_proj())
        tr = self.ax3d.transData.transform((x2, y2))
        return self.ax2d.transData.inverted().transform(tr)

    def image(self,arr,xy):
        """ Place an image (arr) as annotation at position xy """
        im = offsetbox.OffsetImage(arr, zoom=2)
        im.image.axes = ax
        ab = offsetbox.AnnotationBbox(im, xy, xybox=(-30., 30.),
                            xycoords='data', boxcoords="offset points",
                            pad=0.3, arrowprops=dict(arrowstyle="->"))
        self.ax2d.add_artist(ab)
        return ab

    def update(self,event):
        if np.any(self.ax3d.get_w_lims() != self.lim) or \
                        np.any(self.ax3d.get_proj() != self.rot):
            self.lim = self.ax3d.get_w_lims()
            self.rot = self.ax3d.get_proj()
            for s,ab in zip(self.xyz, self.annot):
                ab.xy = self.proj(s)


imgs = [np.random.rand(10,10) for i in range(len(xs))]
ia = ImageAnnotations3D(np.c_[xs,ys,zs],imgs,ax, ax2 )

ax.set_xlabel('X Label')
ax.set_ylabel('Y Label')
ax.set_zlabel('Z Label')
plt.show()
- ImportanceOfBeingErnest
2
谢谢您提供的解决方案!不过,很遗憾我无法旋转/缩放3D图。如果我尝试旋转它,它只会移动图像。这是新版本的问题吗? - lhlmgr
1@lhlmgr 我无法确定是哪个具体的更改导致它不再起作用; 但是我已经更新了代码,使其现在应该可以与任何版本一起使用 - 当然这使它稍微复杂了一些。试试看它是否适用于您。 - ImportanceOfBeingErnest
网页内容由stack overflow 提供, 点击上面的可以查看英文原文,
原文链接
原文链接