Matplotlib误差线图中如何改变顶端样式(cap style)?

3
我正在尝试使用matplotlib.errobar函数绘制误差线,只显示下限误差。如果我使用"uplims=True",我会得到下限误差,但现在有一个箭头作为误差上限。如何将该上限改回水平线?
import numpy as np
import matplotlib.pyplot as plt


fig = plt.figure()
x = np.arange(10)
y = 2.5 *x 
yerr = np.linspace(0.05, 2, 10)

fig1,ax1=plt.subplots()

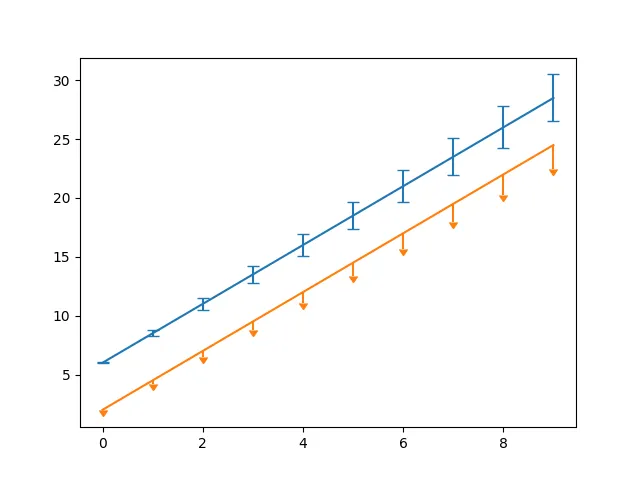
#Here error capstyle is a horizontal line
plt.errorbar(x, y + 6, yerr=yerr,capsize=4, label='both limits (default)')

#Error capstyle suddenly changes to arrow
plt.errorbar(x, y + 2, yerr=yerr, uplims=True, label='uplims=True')

plt.show()

enter image description here

2个回答

0

我想我弄明白了一些事情。

yerr可以是一个列表的列表:

yerr=[lower limits,upper limits]

这不会改变箭头的帽子风格。然后使用上限的零列表和下限的错误长度列表将只在一侧显示误差棒。


0

另一种方法是使用caplines。这将把箭头更改为更常规的误差线。如果您替换了

plt.errorbar(x, y + 2, yerr=yerr, uplims=True, label='uplims=True')

使用

(_, caplines, _,) = plt.errorbar(x, y + 2, yerr=yerr, elinewidth=10, markeredgewidth='10', uplims=True)
caplines[0].set_marker('_')
caplines[0].set_markersize(50)

这将在您的数据下方创建误差条。 elinewidthmarkeredgewidthset_markersize只是为了使误差条看起来漂亮,您可以根据需要更改这些值。请注意,您需要设置

caplines[0].set_marker('_')
caplines[0].set_markersize(50)

在每个plt.errorbar之后,您不能使用此设置仅设置它们一次。

网页内容由stack overflow 提供, 点击上面的
可以查看英文原文,
原文链接