我正在尝试对某个环境中的某些进度进行建模。x轴将表示环境中的位置(基于x坐标)。
为了清晰起见,我想在我的图表的x轴上(环境相当宽且不那么高,因此应该看起来很好)使用一个基于.png的环境图像,基本上作为xtics / x轴标签。
你有什么关于如何处理这个问题的建议吗?
提前致谢!
为了清晰起见,我想在我的图表的x轴上(环境相当宽且不那么高,因此应该看起来很好)使用一个基于.png的环境图像,基本上作为xtics / x轴标签。
你有什么关于如何处理这个问题的建议吗?
提前致谢!
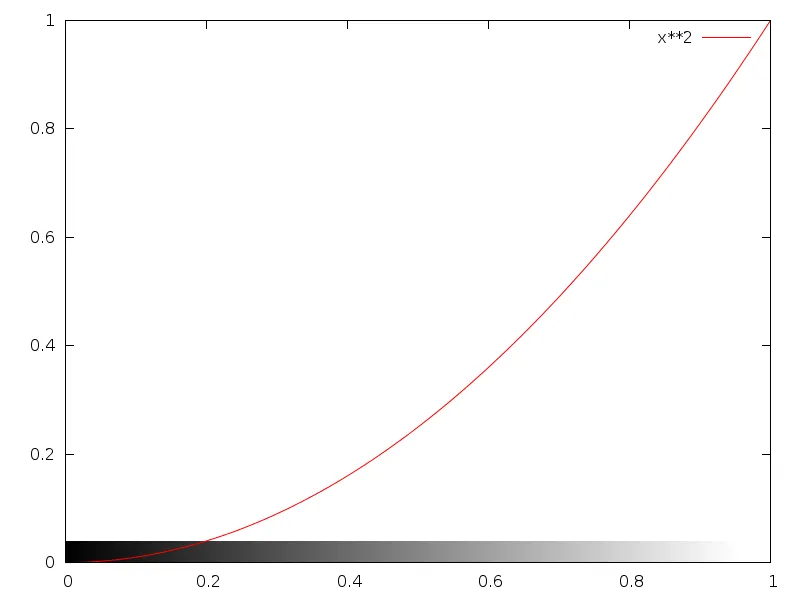
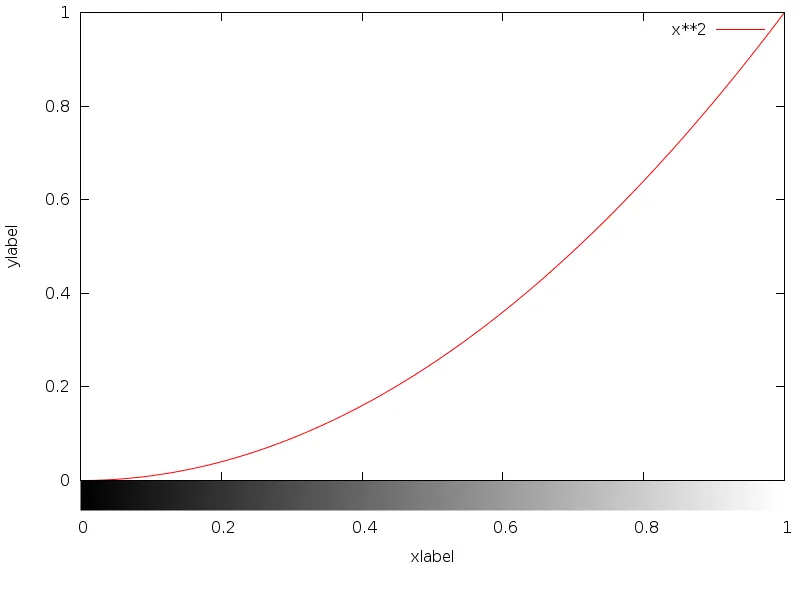
plot命令同时绘制图像和数据,或者使用multiplot。第一种方式更简单,但是图像在绘图内部;第二种方式稍微复杂一些,但允许任意位置放置“轴图像”。
用于轴的虚拟图像“gradient.png”如下:

set yrange[0:1]
set xrange[0:1]
plot 'gradient.png' binary filetype=png dx=0.0015 dy=0.002 with rgbimage t '',\
     x**2
结果是:
set yrange[0:1]
set xrange[0:1]

set lmargin at screen 0.1
set rmargin at screen 0.98
set tmargin at screen 0.98
set bmargin at screen 0.2
set xtics offset 0,-1.5
set xlabel 'xlabel' offset 0,-1.5
set ylabel 'ylabel'

set multiplot
plot x**2

set tmargin at screen 0.2
set bmargin at screen 0.15
unset border
unset tics
unset xlabel
unset ylabel
unset key
set autoscale xy
plot 'gradient.png' binary filetype=png with rgbimage
unset multiplot
如您所见,这需要更多的努力。具体解释如下:
您必须设置明确的边距,以便坐标轴图像可以准确地放置在主绘图下方。
在绘制坐标轴图像之前,您必须删除tics、labels,将范围重置为autoscale等(因此您还必须设置固定的lmargin和rmargin)。
要绘制图像本身,请使用绘图样式with rgbimage。
您必须微调xtics和xlabel偏移量以及边距。
最终生成的图片如下:
plot 'file.png' binary filetype=png并且可能使用dx、dy和origin来调整比例:例如plot 'file.png' binary filetype=png dx=0.1 dy=0.01 origin=(10,10)。 - Christophwith rgbimage。我马上会发布一个答案。 - Christoph