我正在尝试创建一个
使用
使用
创建一个布局矩阵,其高度基于每列中国家的数量。
如上所述,我一直在适应
facet_multi_col()函数,类似于ggforce中的facet_col()函数 - 它允许使用空间参数(在facet_wrap()中不可用)进行面板布局 - 但是可以跨多列。就像下面的最后一个图(使用grid.arrange()创建)一样,我不希望各个面板必须在行上对齐,因为每个面板中的高度将根据我想要使用的分类y变量而异。
我发现自己在阅读扩展guide后已经超出了我的能力范围,其中包括ggproto。我认为最好的方法是传递一个布局矩阵来指示在相应的数据子集中何时断开列,并基于facet_col在 ggforce 中构建一个包含空间参数的函数 - 请参见问题结尾。
我不满意的选项的快速说明
没有面板
library(tidyverse)
library(gapminder)
global_tile <- ggplot(data = gapminder, mapping = aes(x = year, y = fct_rev(country), fill = lifeExp)) +
  geom_tile()
global_tile
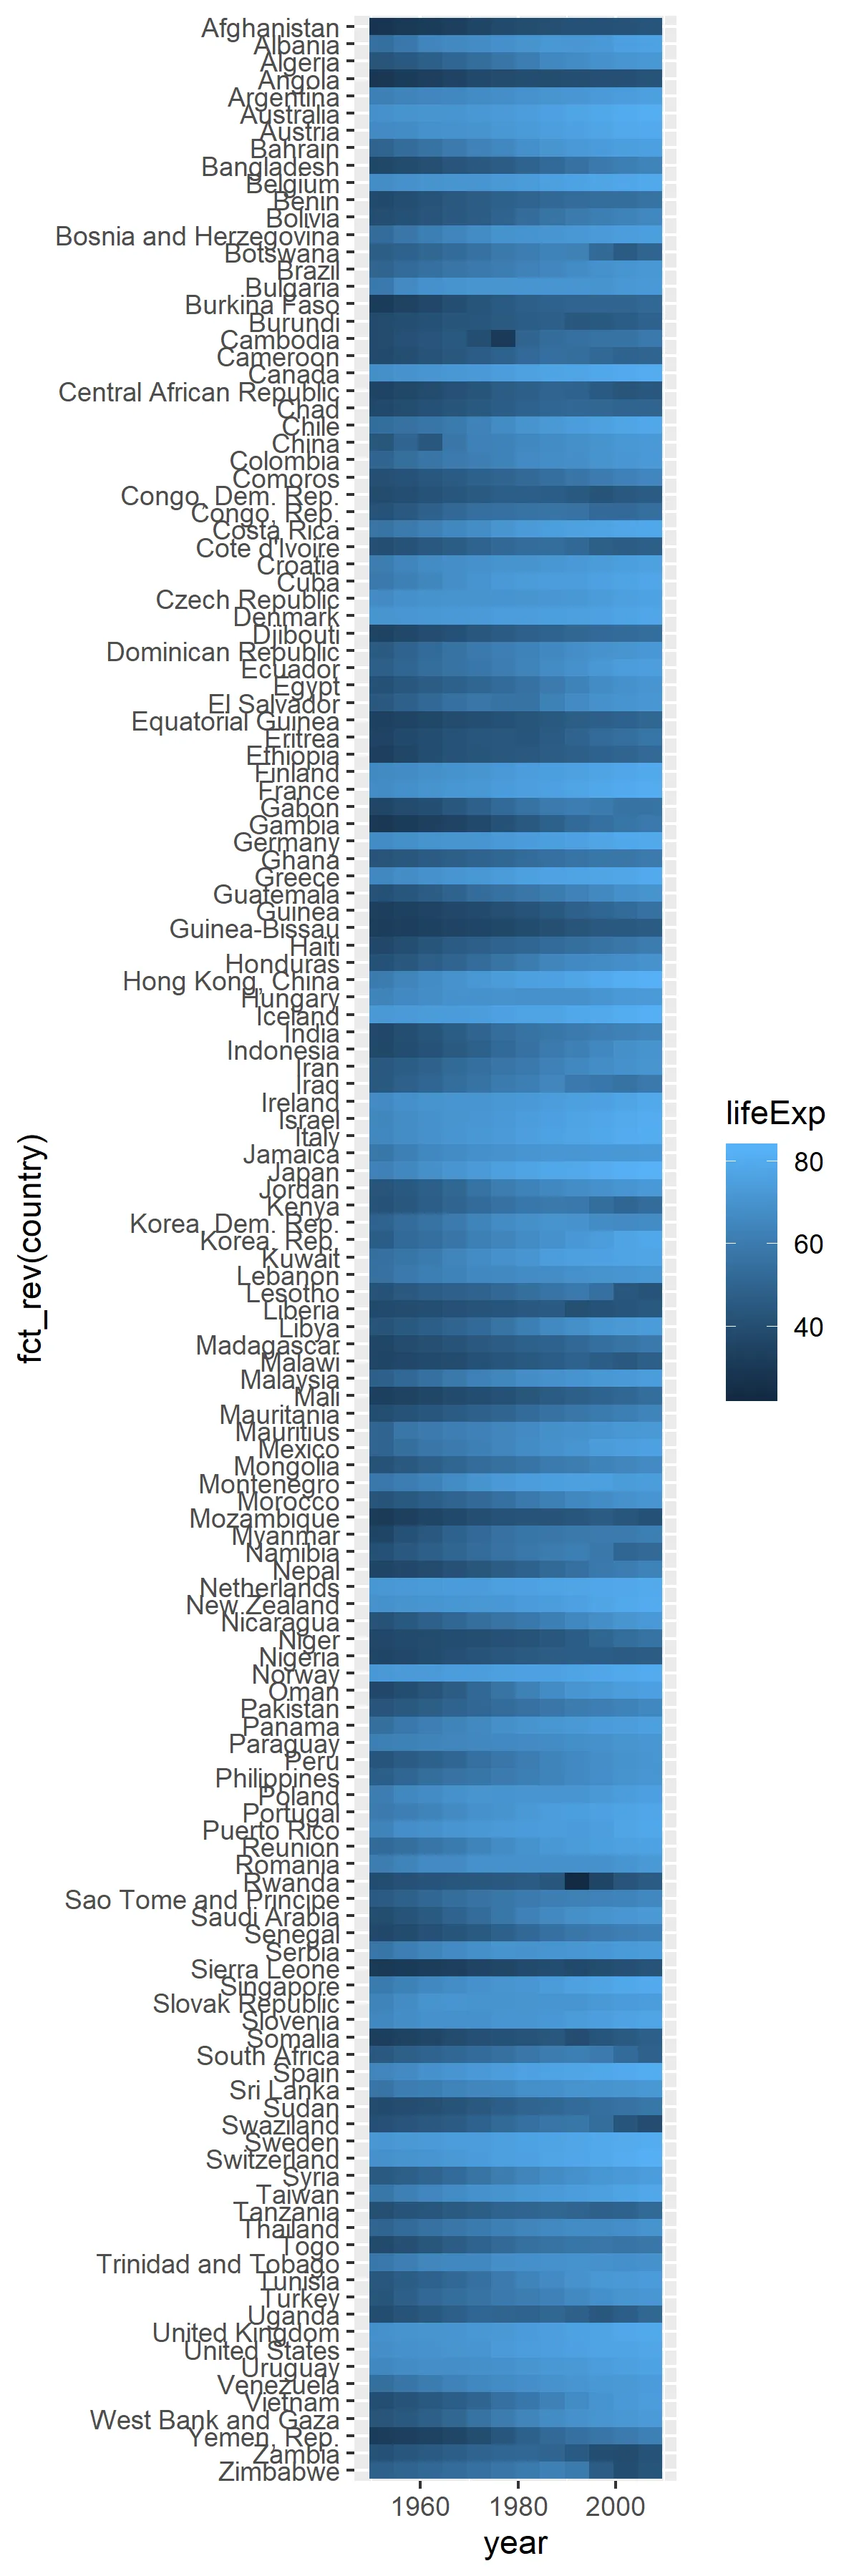 我想按大洲分类分解情节,但不想要这么长的图。
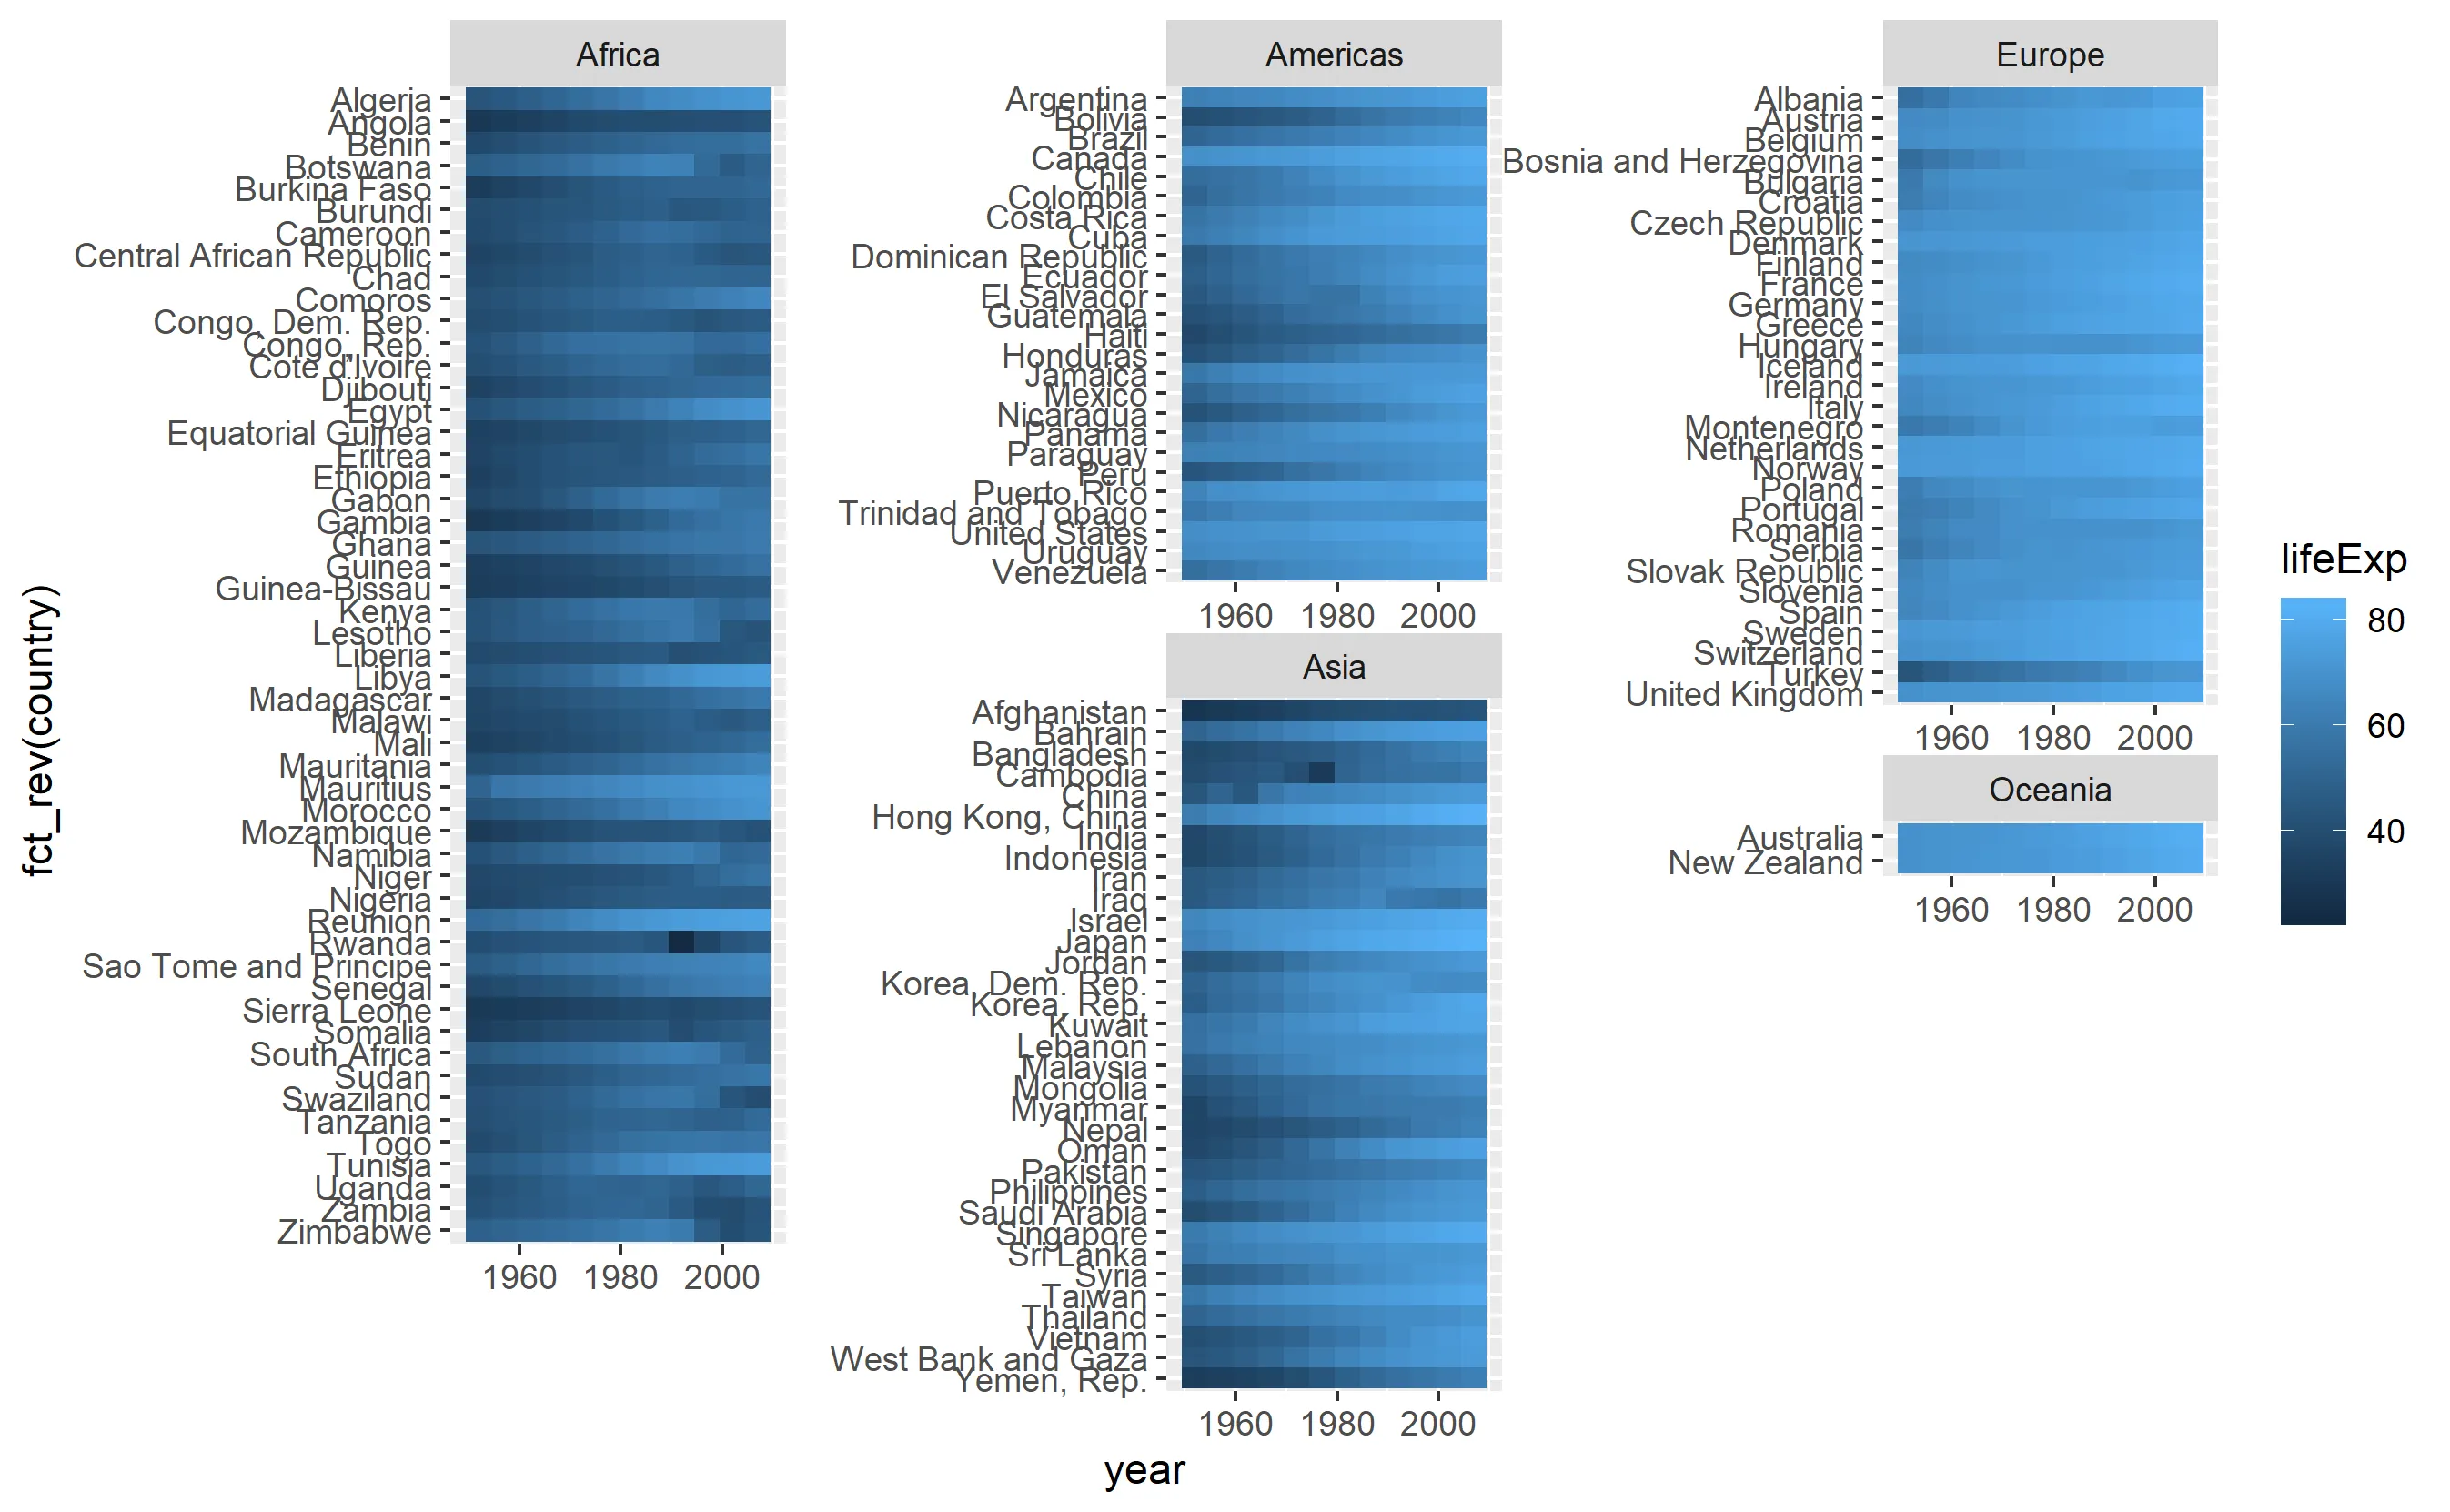
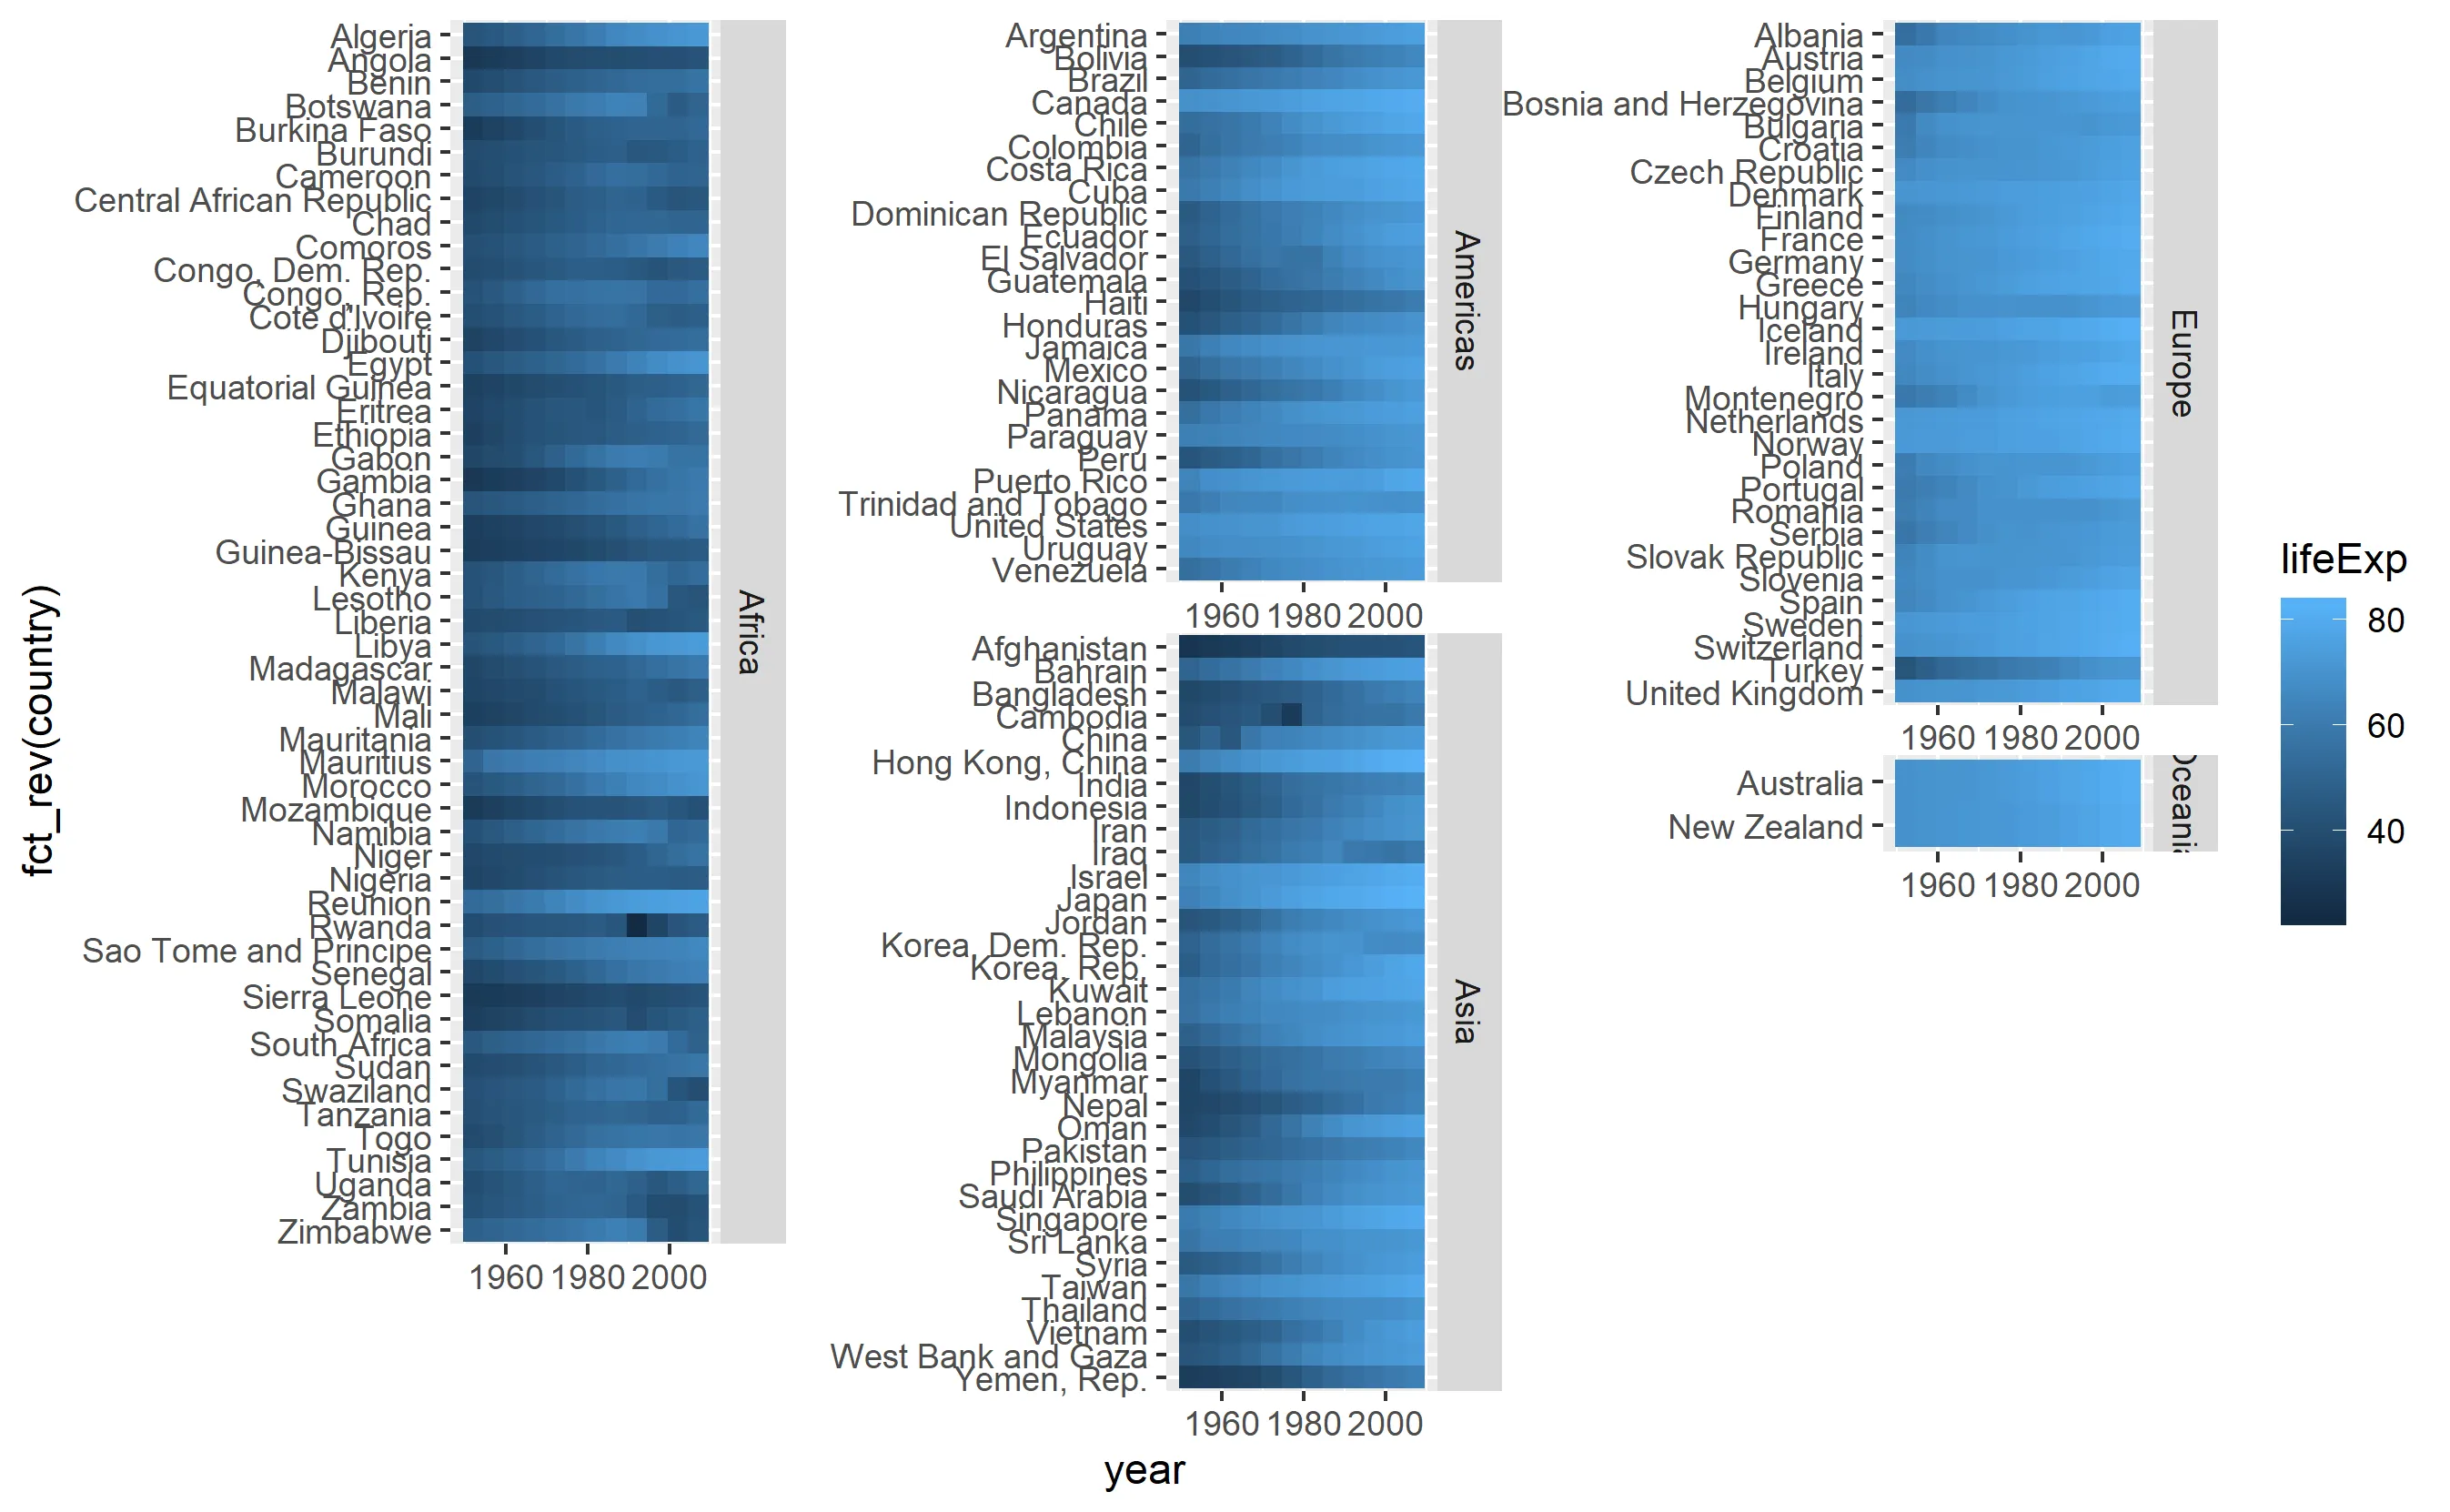
facet_wrap()
global_tile +
  facet_wrap(facets = "continent", scales = "free")

facet_wrap()没有空间参数,这意味着每个大陆的图块大小不同,使用coord_equal()会引发错误。
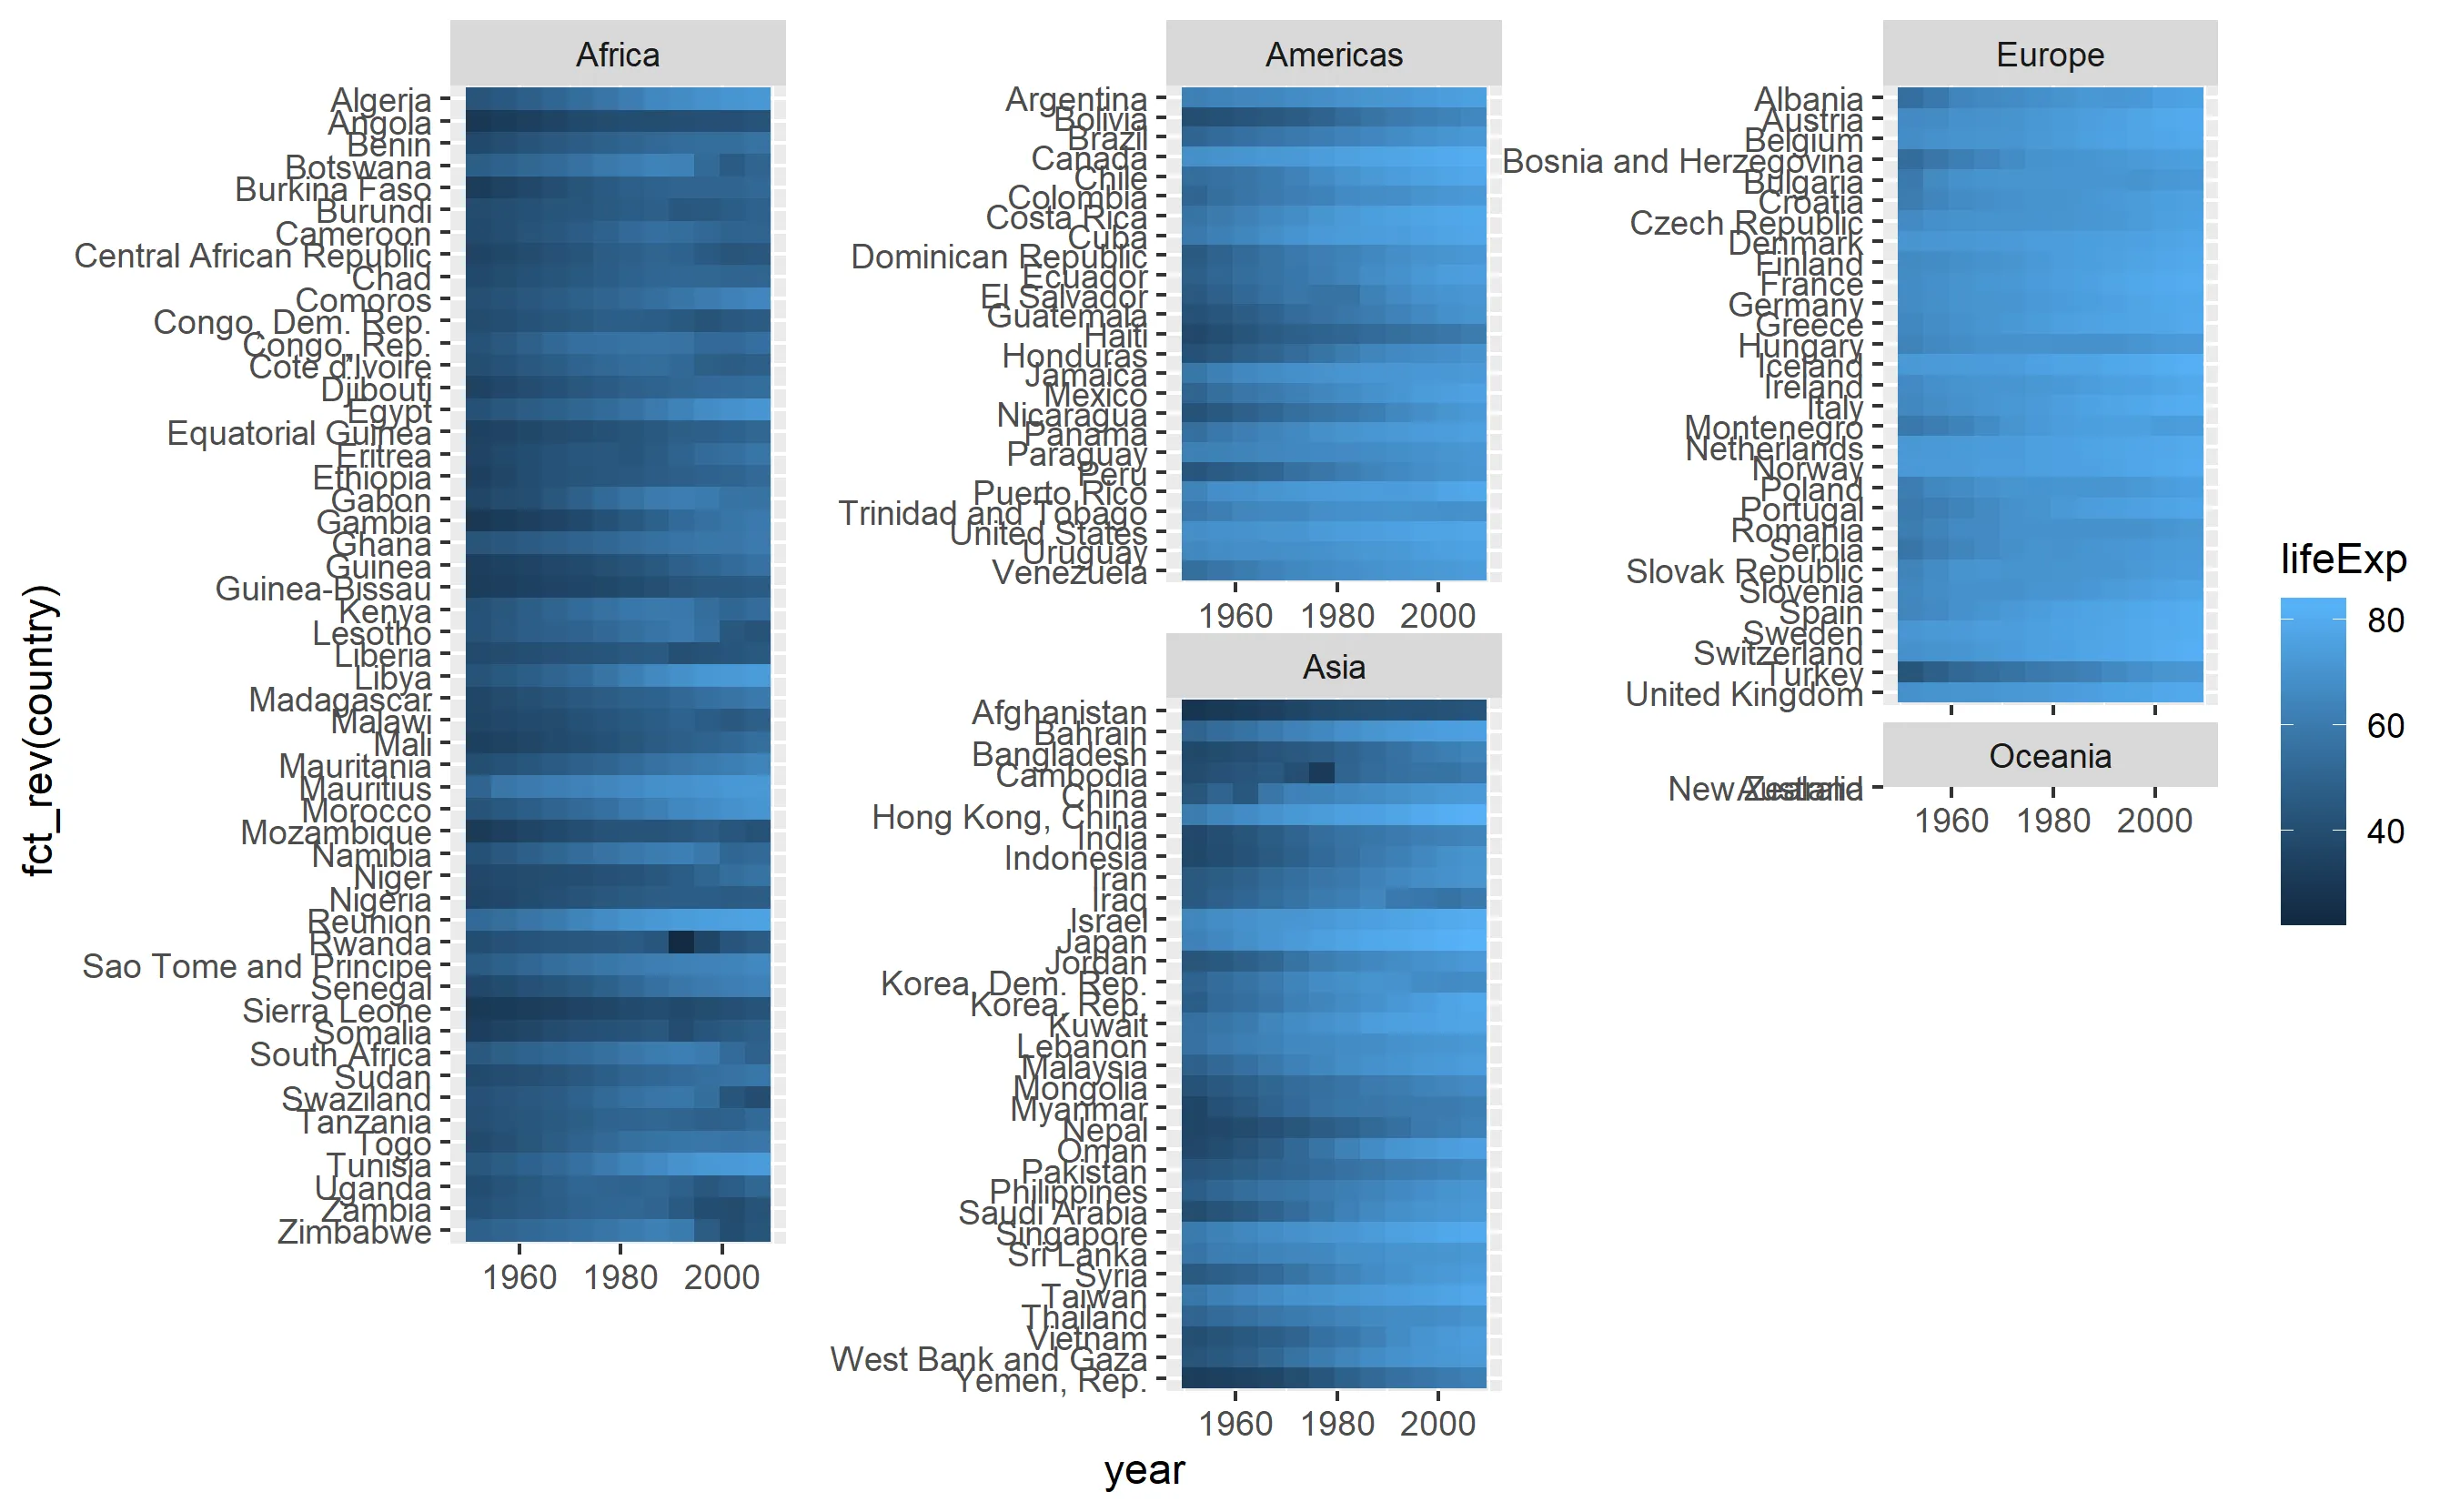
ggforce中的facet_col()
library(ggforce)
global_tile +
  facet_col(facets = "continent", scales = "free", space = "free", strip.position = "right") +
  theme(strip.text.y = element_text(angle = 0))
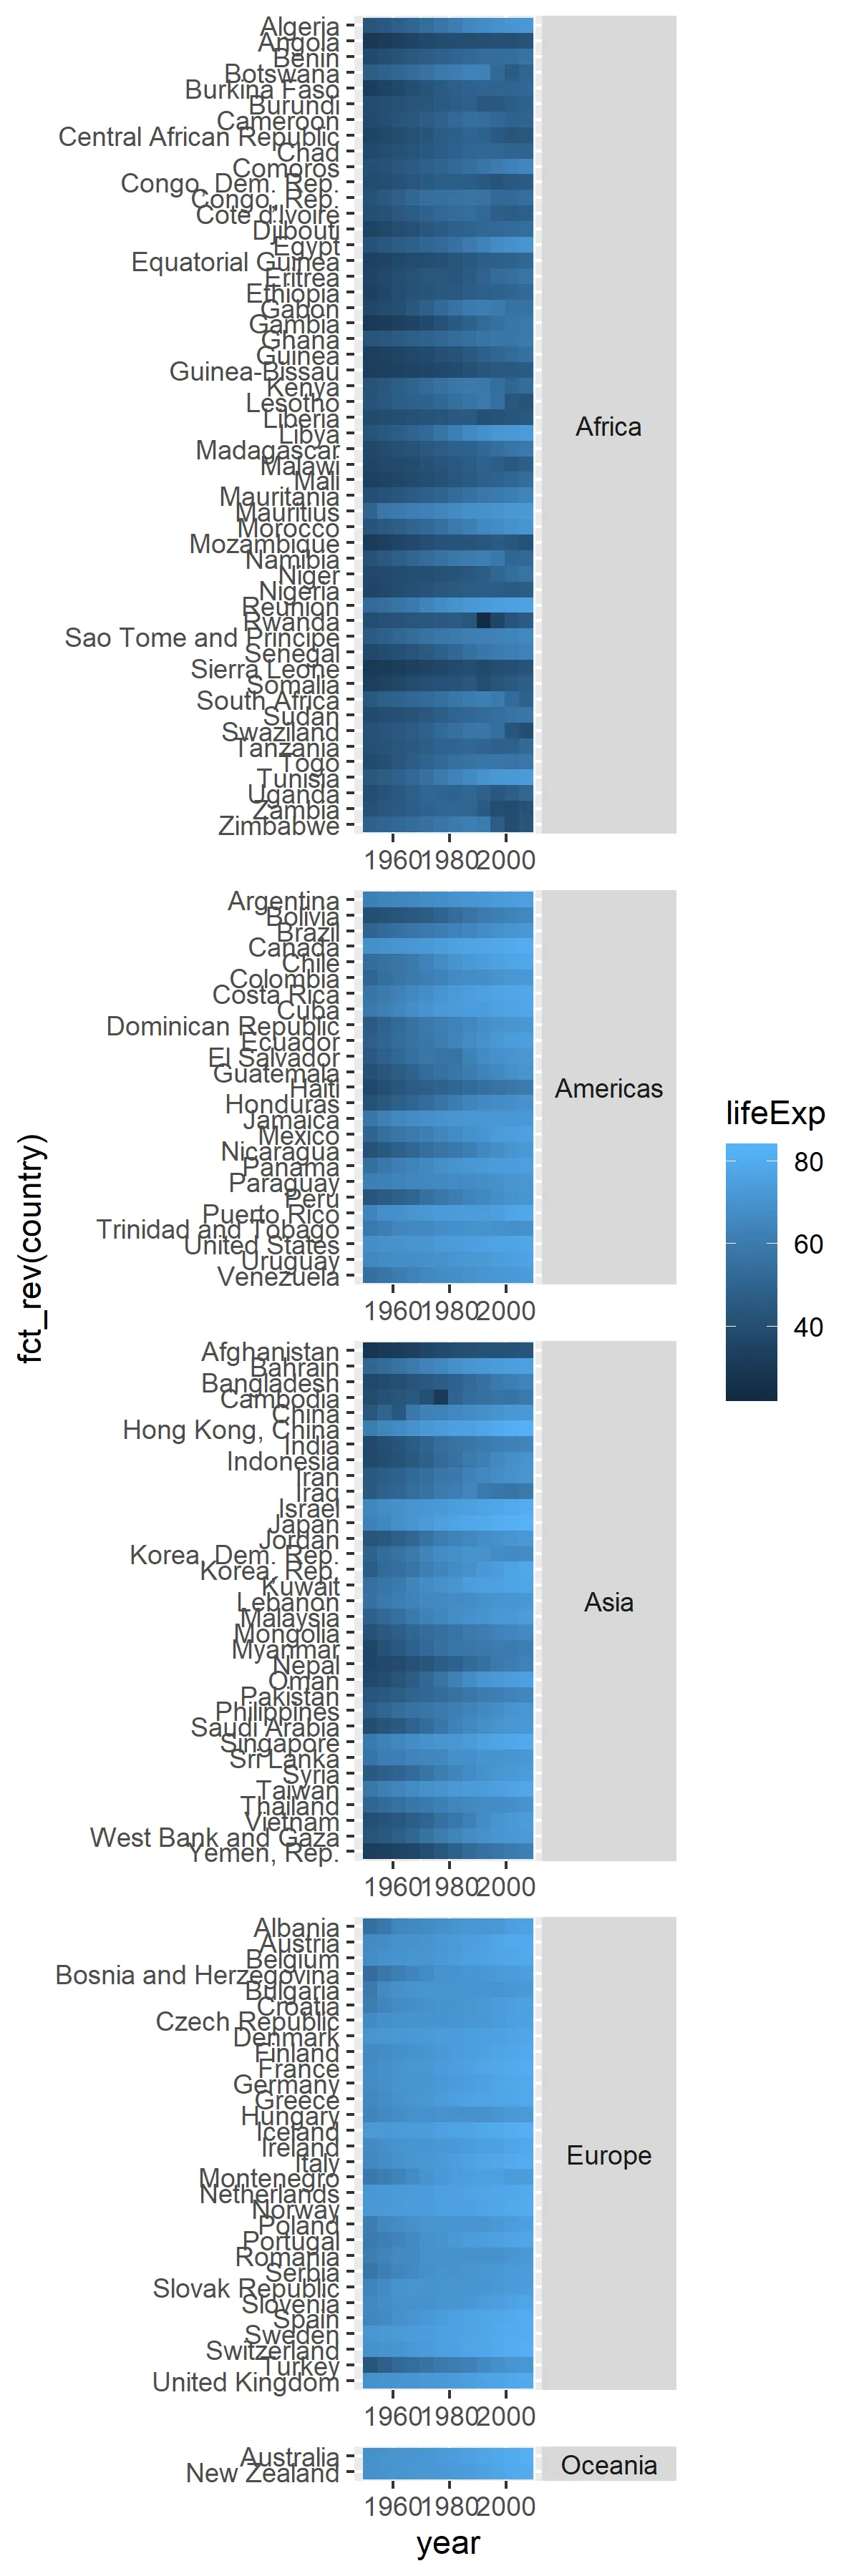 喜欢侧面的条纹。
 space 参数将所有瓷砖设置为相同的大小。 仍然太长无法适合页面。
gridExtra中的grid.arrange()
为每个大陆应放置的位置添加一个列列
d <- gapminder %>%
  as_tibble() %>%
  mutate(col = as.numeric(continent),
         col = ifelse(test = continent == "Europe", yes = 2, no = col),
         col = ifelse(test = continent == "Oceania", yes = 3, no = col))
head(d)
# # A tibble: 6 x 7
#   country     continent  year lifeExp      pop gdpPercap   col
#   <fct>       <fct>     <int>   <dbl>    <int>     <dbl> <dbl>
# 1 Afghanistan Asia       1952    28.8  8425333      779.     3
# 2 Afghanistan Asia       1957    30.3  9240934      821.     3
# 3 Afghanistan Asia       1962    32.0 10267083      853.     3
# 4 Afghanistan Asia       1967    34.0 11537966      836.     3
# 5 Afghanistan Asia       1972    36.1 13079460      740.     3
# 6 Afghanistan Asia       1977    38.4 14880372      786.     3
tail(d)
# # A tibble: 6 x 7
#   country  continent  year lifeExp      pop gdpPercap   col
#   <fct>    <fct>     <int>   <dbl>    <int>     <dbl> <dbl>
# 1 Zimbabwe Africa     1982    60.4  7636524      789.     1
# 2 Zimbabwe Africa     1987    62.4  9216418      706.     1
# 3 Zimbabwe Africa     1992    60.4 10704340      693.     1
# 4 Zimbabwe Africa     1997    46.8 11404948      792.     1
# 5 Zimbabwe Africa     2002    40.0 11926563      672.     1
# 6 Zimbabwe Africa     2007    43.5 12311143      470.     1
使用
facet_col()函数为每一列绘制图表。g <- list()
for(i in unique(d$col)){
g[[i]] <- d %>%
filter(col == i) %>%
ggplot(mapping = aes(x = year, y = fct_rev(country), fill = lifeExp)) +
geom_tile() +
facet_col(facets = "continent", scales = "free_y", space = "free", strip.position = "right") +
theme(strip.text.y = element_text(angle = 0)) +
# aviod legends in every column
guides(fill = FALSE) +
labs(x = "", y = "")
}
使用
cowplot中的get_legend()创建图例。library(cowplot)
gg <- ggplot(data = d, mapping = aes(x = year, y = country, fill = lifeExp)) +
geom_tile()
leg <- get_legend(gg)
创建一个布局矩阵,其高度基于每列中国家的数量。
m <-
  d %>%
  group_by(col) %>%
  summarise(row = n_distinct(country)) %>%
  rowwise() %>%
  mutate(row = paste(1:row, collapse = ",")) %>%
  separate_rows(row) %>%
  mutate(row = as.numeric(row),
         col = col,
         p = col) %>%
  xtabs(formula = p ~ row + col) %>%
  cbind(max(d$col) + 1) %>%
  ifelse(. == 0, NA, .)

head(m)
#   1 2 3
# 1 1 2 3 4
# 2 1 2 3 4
# 3 1 2 3 4
# 4 1 2 3 4
# 5 1 2 3 4
# 6 1 2 3 4

tail(m)
#     1 2  3
# 50  1 2 NA 4
# 51  1 2 NA 4
# 52  1 2 NA 4
# 53 NA 2 NA 4
# 54 NA 2 NA 4
# 55 NA 2 NA 4
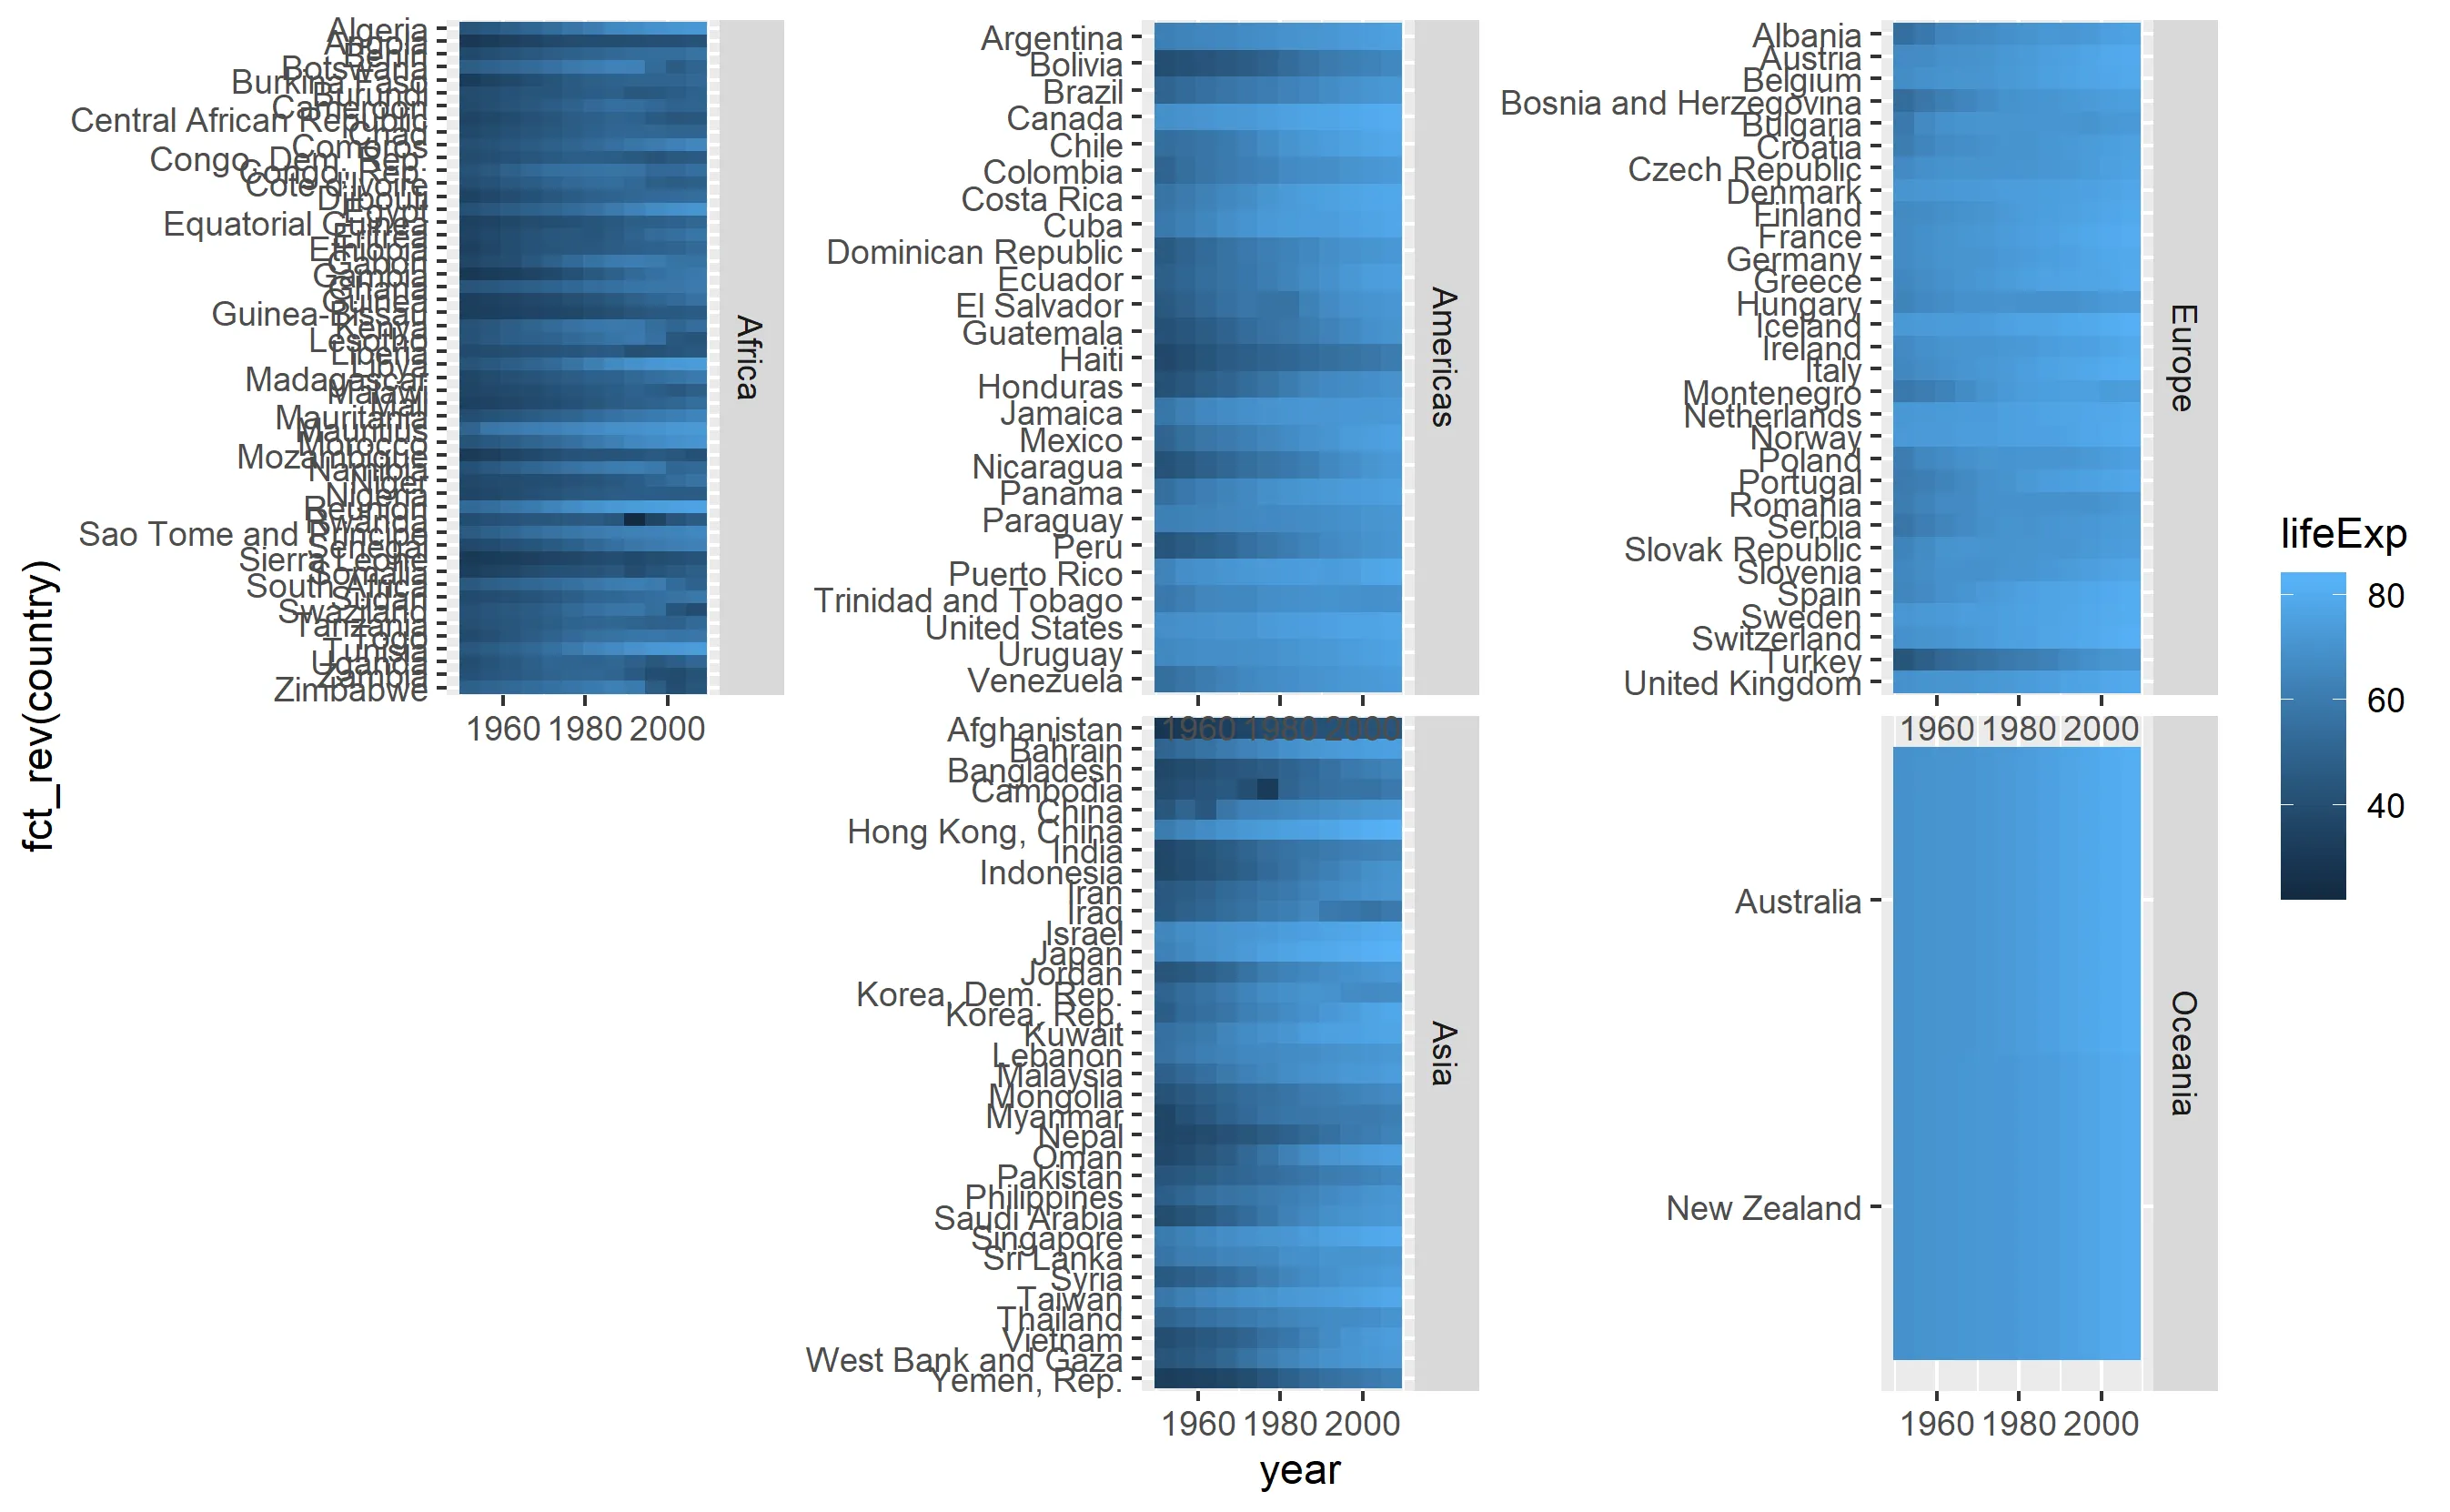
在gridExtra中使用grid.arrange()将g和leg组合在一起。
library(gridExtra)
grid.arrange(g[[1]], g[[2]], g[[3]], leg, layout_matrix = m, widths=c(0.32, 0.32, 0.32, 0.06))
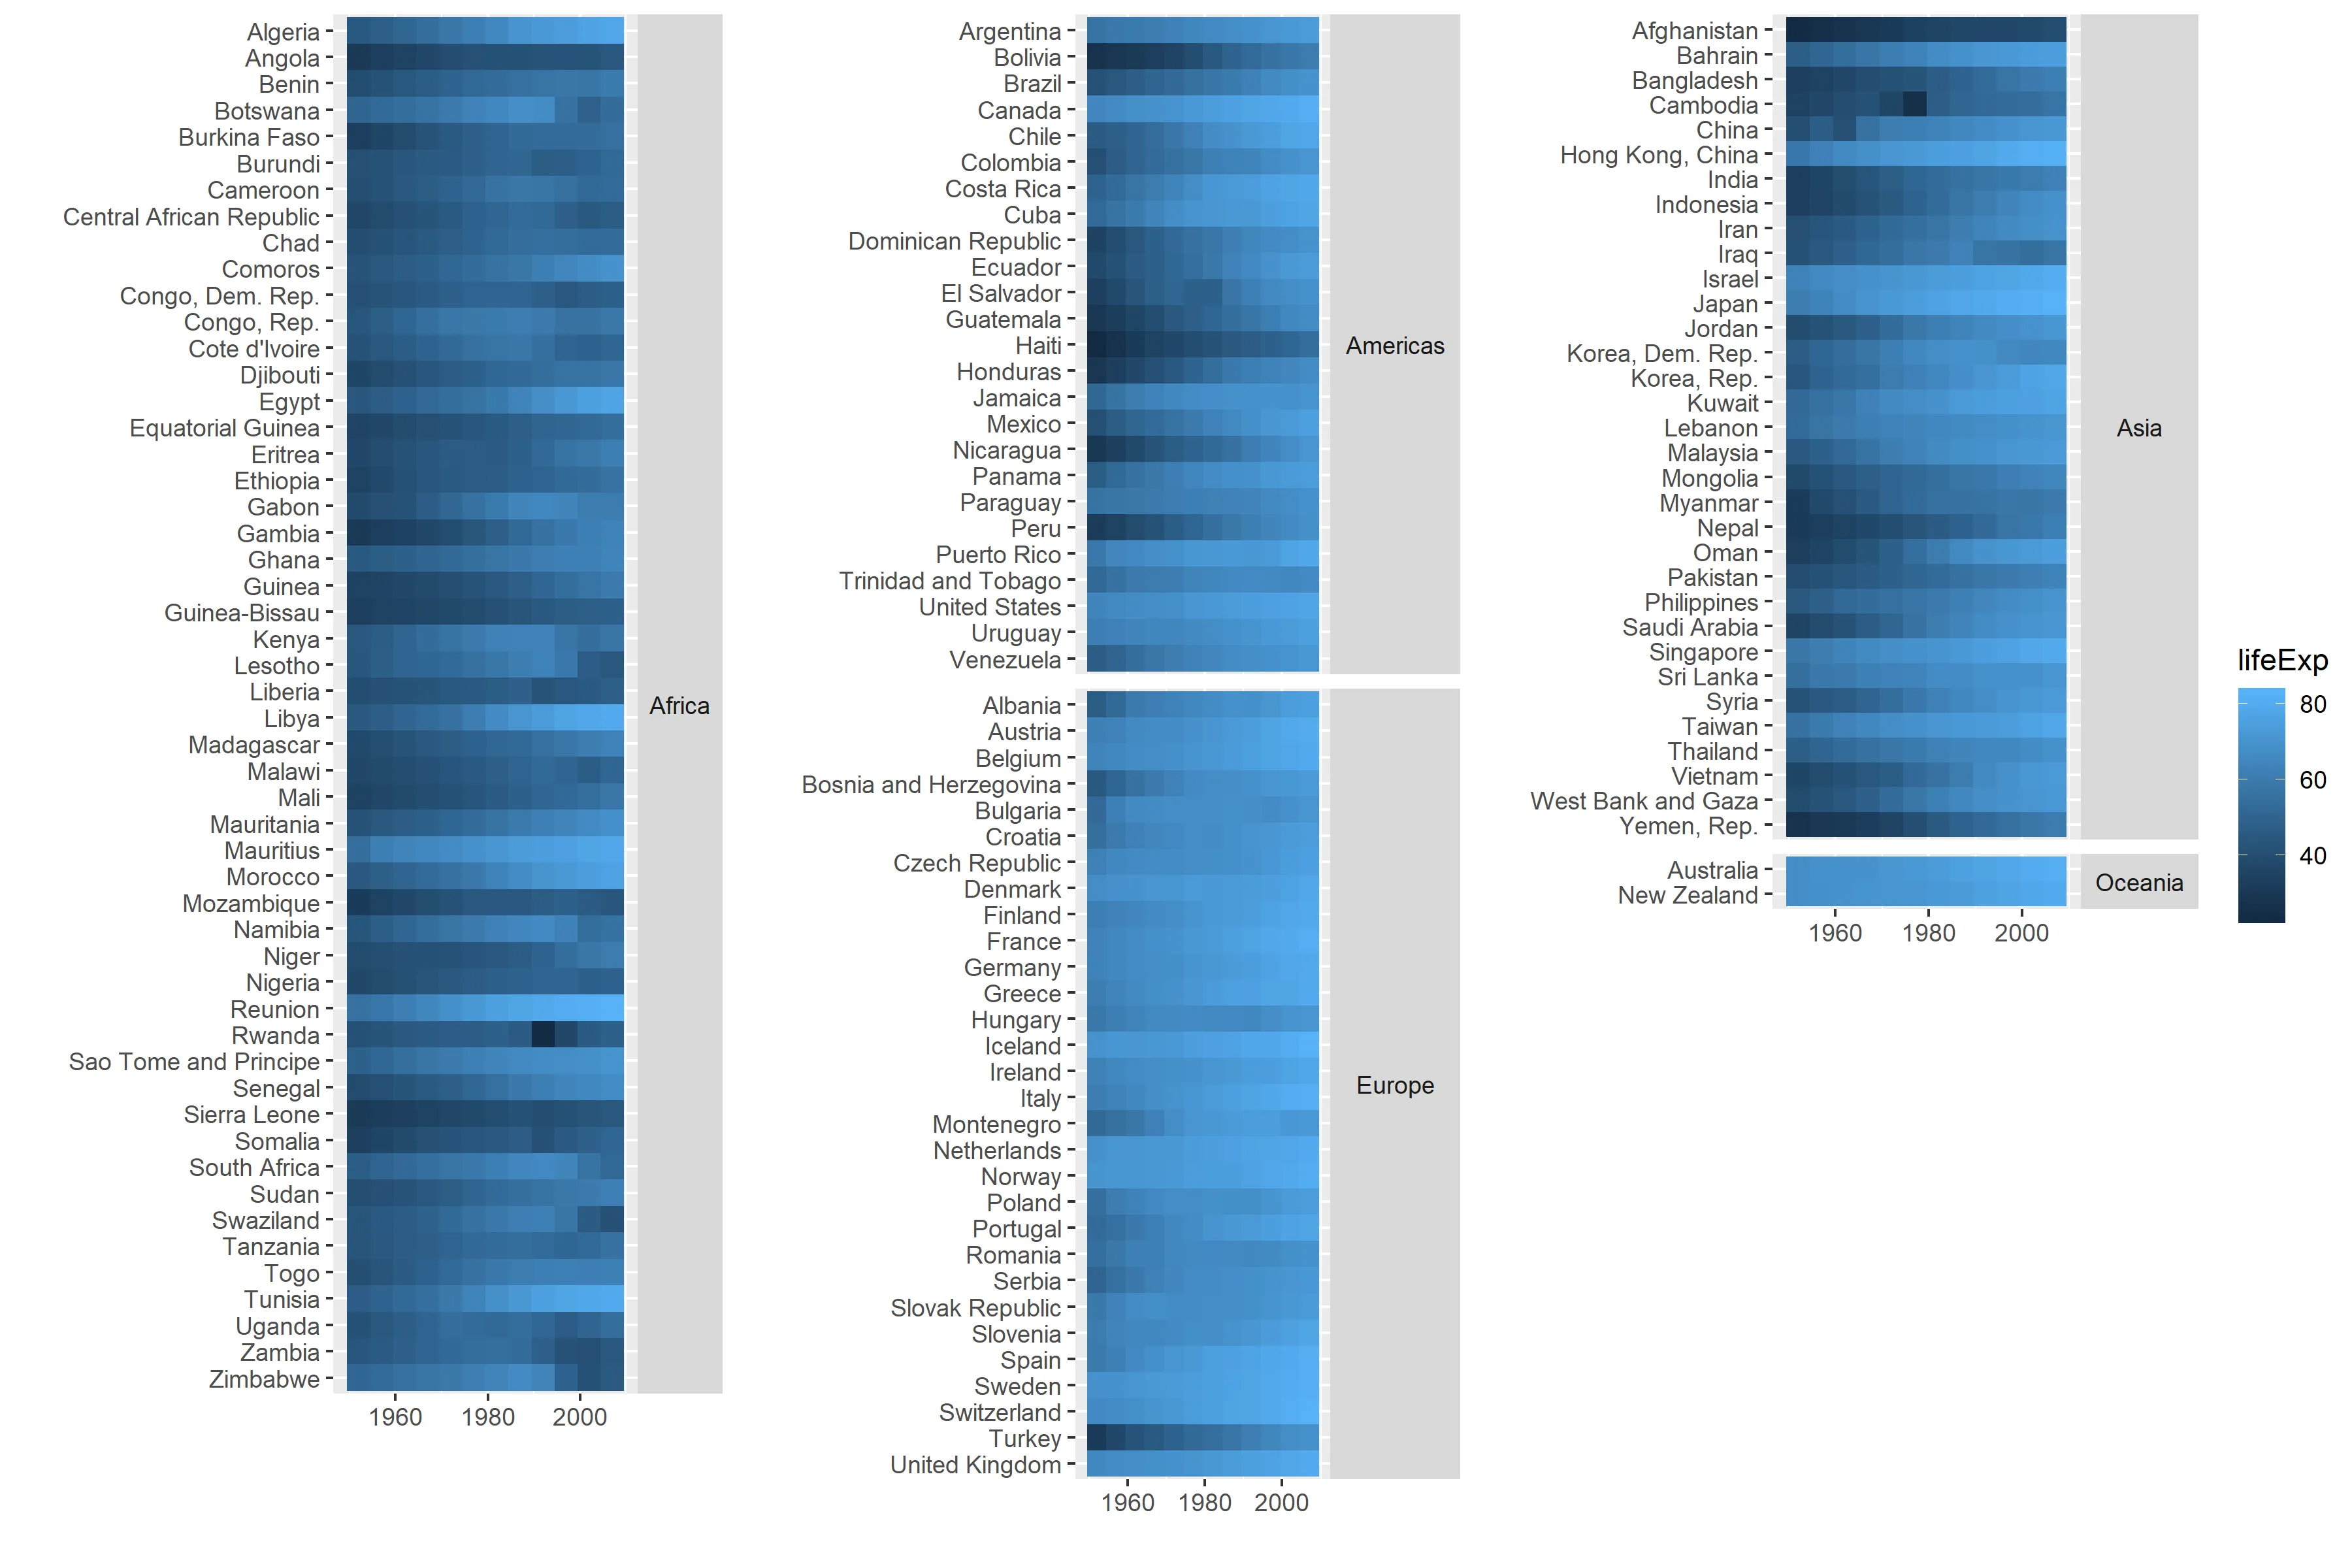 这几乎是我想要的,但我不满意的是a)不同列中的瓷砖具有不同的宽度,因为最长的国家和大陆名称的长度不相等;b)这是一堆需要调整的代码,每次我想制作这样的图时都需要进行调整 - 对于其他数据,我想按区域排列外观,例如“西欧”,而不是大陆或国家数量发生变化 - 在
gapminder数据中没有中亚国家。
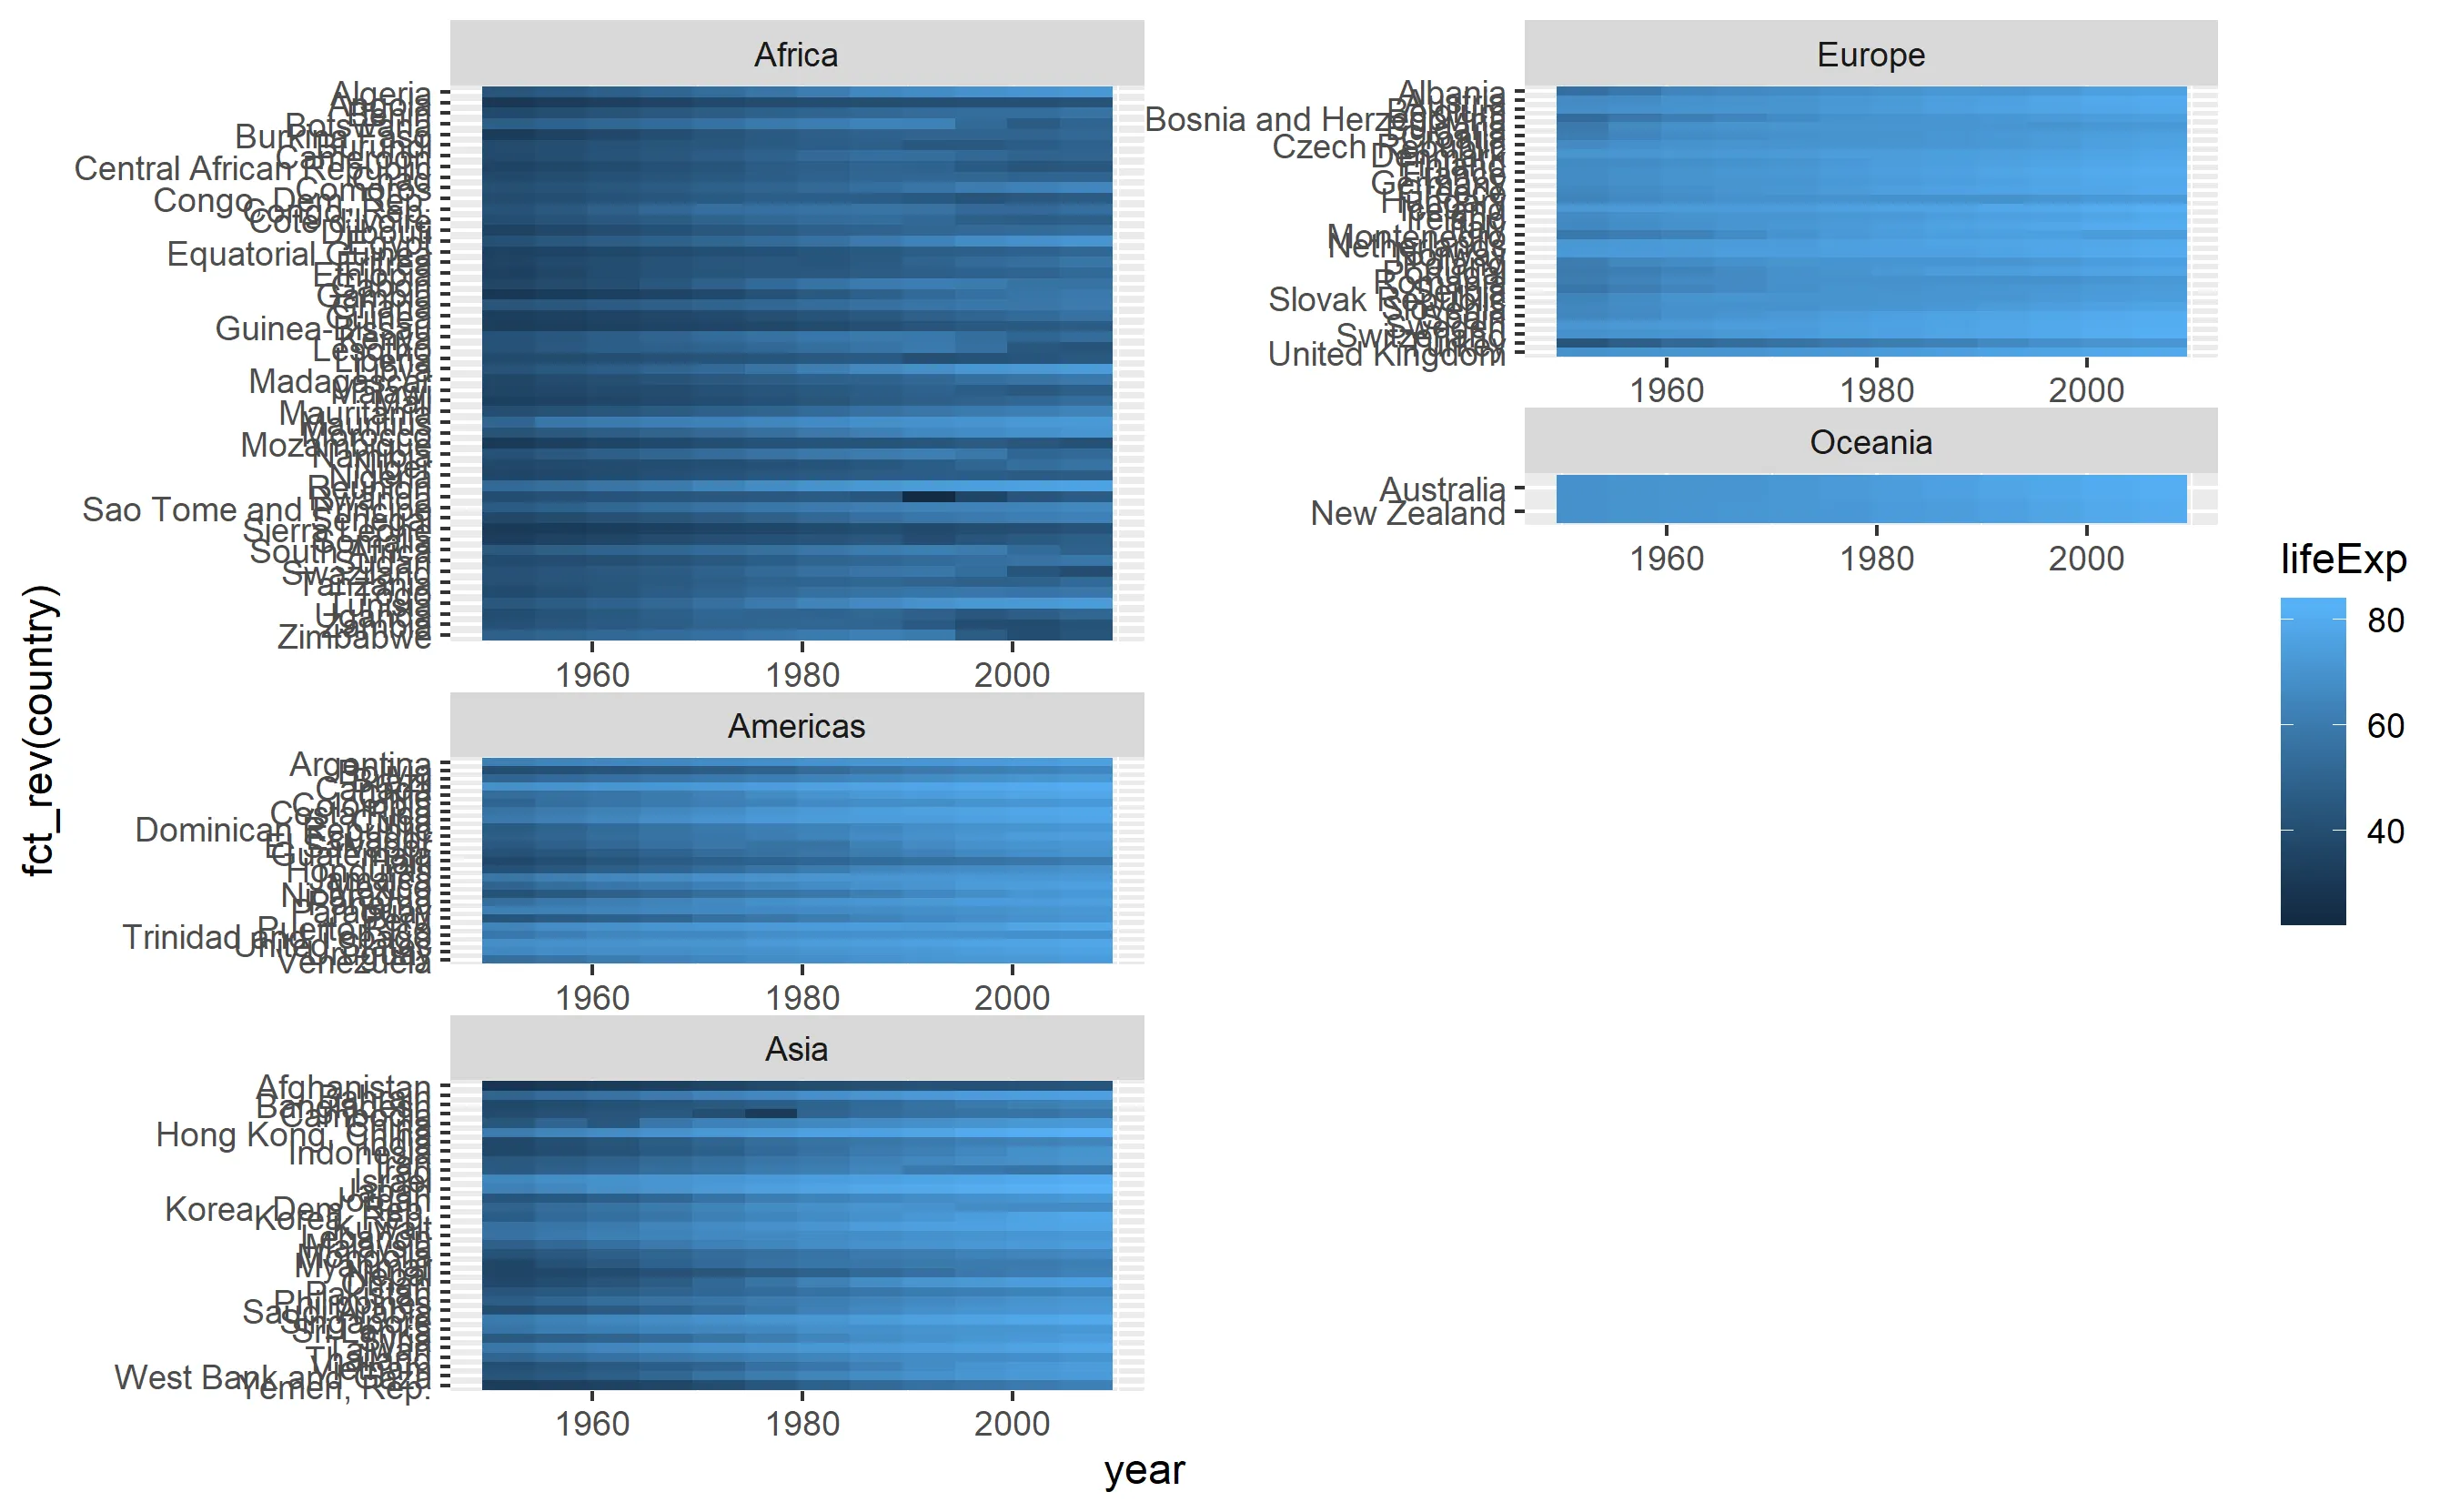
创建facet_multi_cols()函数的进展
我想将布局矩阵传递给facet函数,其中矩阵将引用每个facet,并且函数可以根据每个面板中空格数来确定高度。对于上面的示例,矩阵将为:
my_layout <- matrix(c(1, NA, 2, 3, 4, 5), nrow = 2)
my_layout
#      [,1] [,2] [,3]
# [1,]    1    2    4
# [2,]   NA    3    5
如上所述,我一直在适应
facet_col()中的代码,以尝试构建一个facet_multi_col()函数。我添加了一个layout参数来提供类似于上面的my_layout的矩阵,其想法是,例如,将给定给facets参数的变量的第四和第五级绘制在第三列中。facet_multi_col <- function(facets, layout, scales = "fixed", space = "fixed",
shrink = TRUE, labeller = "label_value",
drop = TRUE, strip.position = 'top') {
# add space argument as in facet_col
space <- match.arg(space, c('free', 'fixed'))
facet <- facet_wrap(facets, col = col, dir = dir, scales = scales, shrink = shrink, labeller = labeller, drop = drop, strip.position = strip.position)
params <- facet$params
params <- facet$layout
params$space_free <- space == 'free'
ggproto(NULL, FacetMultiCols, shrink = shrink, params = params)
}
FacetMultiCols <- ggproto('FacetMultiCols', FacetWrap,
# from FacetCols to allow for space argument to work
draw_panels = function(self, panels, layout, x_scales, y_scales, ranges, coord, data, theme, params) {
combined <- ggproto_parent(FacetWrap, self)$draw_panels(panels, layout, x_scales, y_scales, ranges, coord, data, theme, params)
if (params$space_free) {
widths <- vapply(layout$PANEL, function(i) diff(ranges[[i]]$x.range), numeric(1))
panel_widths <- unit(widths, "null")
combined$widths[panel_cols(combined)$l] <- panel_widths
}
combined
}
# adapt FacetWrap layout to set position on panels following the matrix given to layout in facet_multi_col().
compute_layout = function(self, panels, layout, x_scales, y_scales, ranges, coord, data, theme, params) {
layout <- ggproto_parent(FacetWrap, self)$compute_layout(panels, layout, x_scales, y_scales, ranges, coord, data, theme, params)
# ???
)
我认为我需要为compute_layout部分编写一些内容,但我很难想出如何做到这一点。

grid.arrange示例中..除非你指的是不同的东西?我认为在每列中使用不同的标签长度会存在相同的问题。 - guyabelgrid.arrange更好地帮助对齐。这是一篇非常长的文章,所以很难跟上你尝试的所有内容。有点 hacky,但你可以尝试使用等宽字体/更加均匀间距的标签,以便它们的长度更可预测。你甚至可以用空格填充标签,以确保文本更接近相同的长度。 - camille