我有一个数据框,想要将其作为条形图绘制,但我希望分类的x值按照我指定的列表顺序进行排序。我将使用mtcars数据集示例说明。
#get a small version of the mtcars dataset and add a named column
mtcars2 <- mtcars
mtcars2[["car"]] <- rownames(mtcars2)
mtcars2 <- mtcars[0:5,]
# I would like to plot this using the following
p = ggplot(mtcars2, aes(x=car, y=mpg))+ geom_bar(stat="identity")
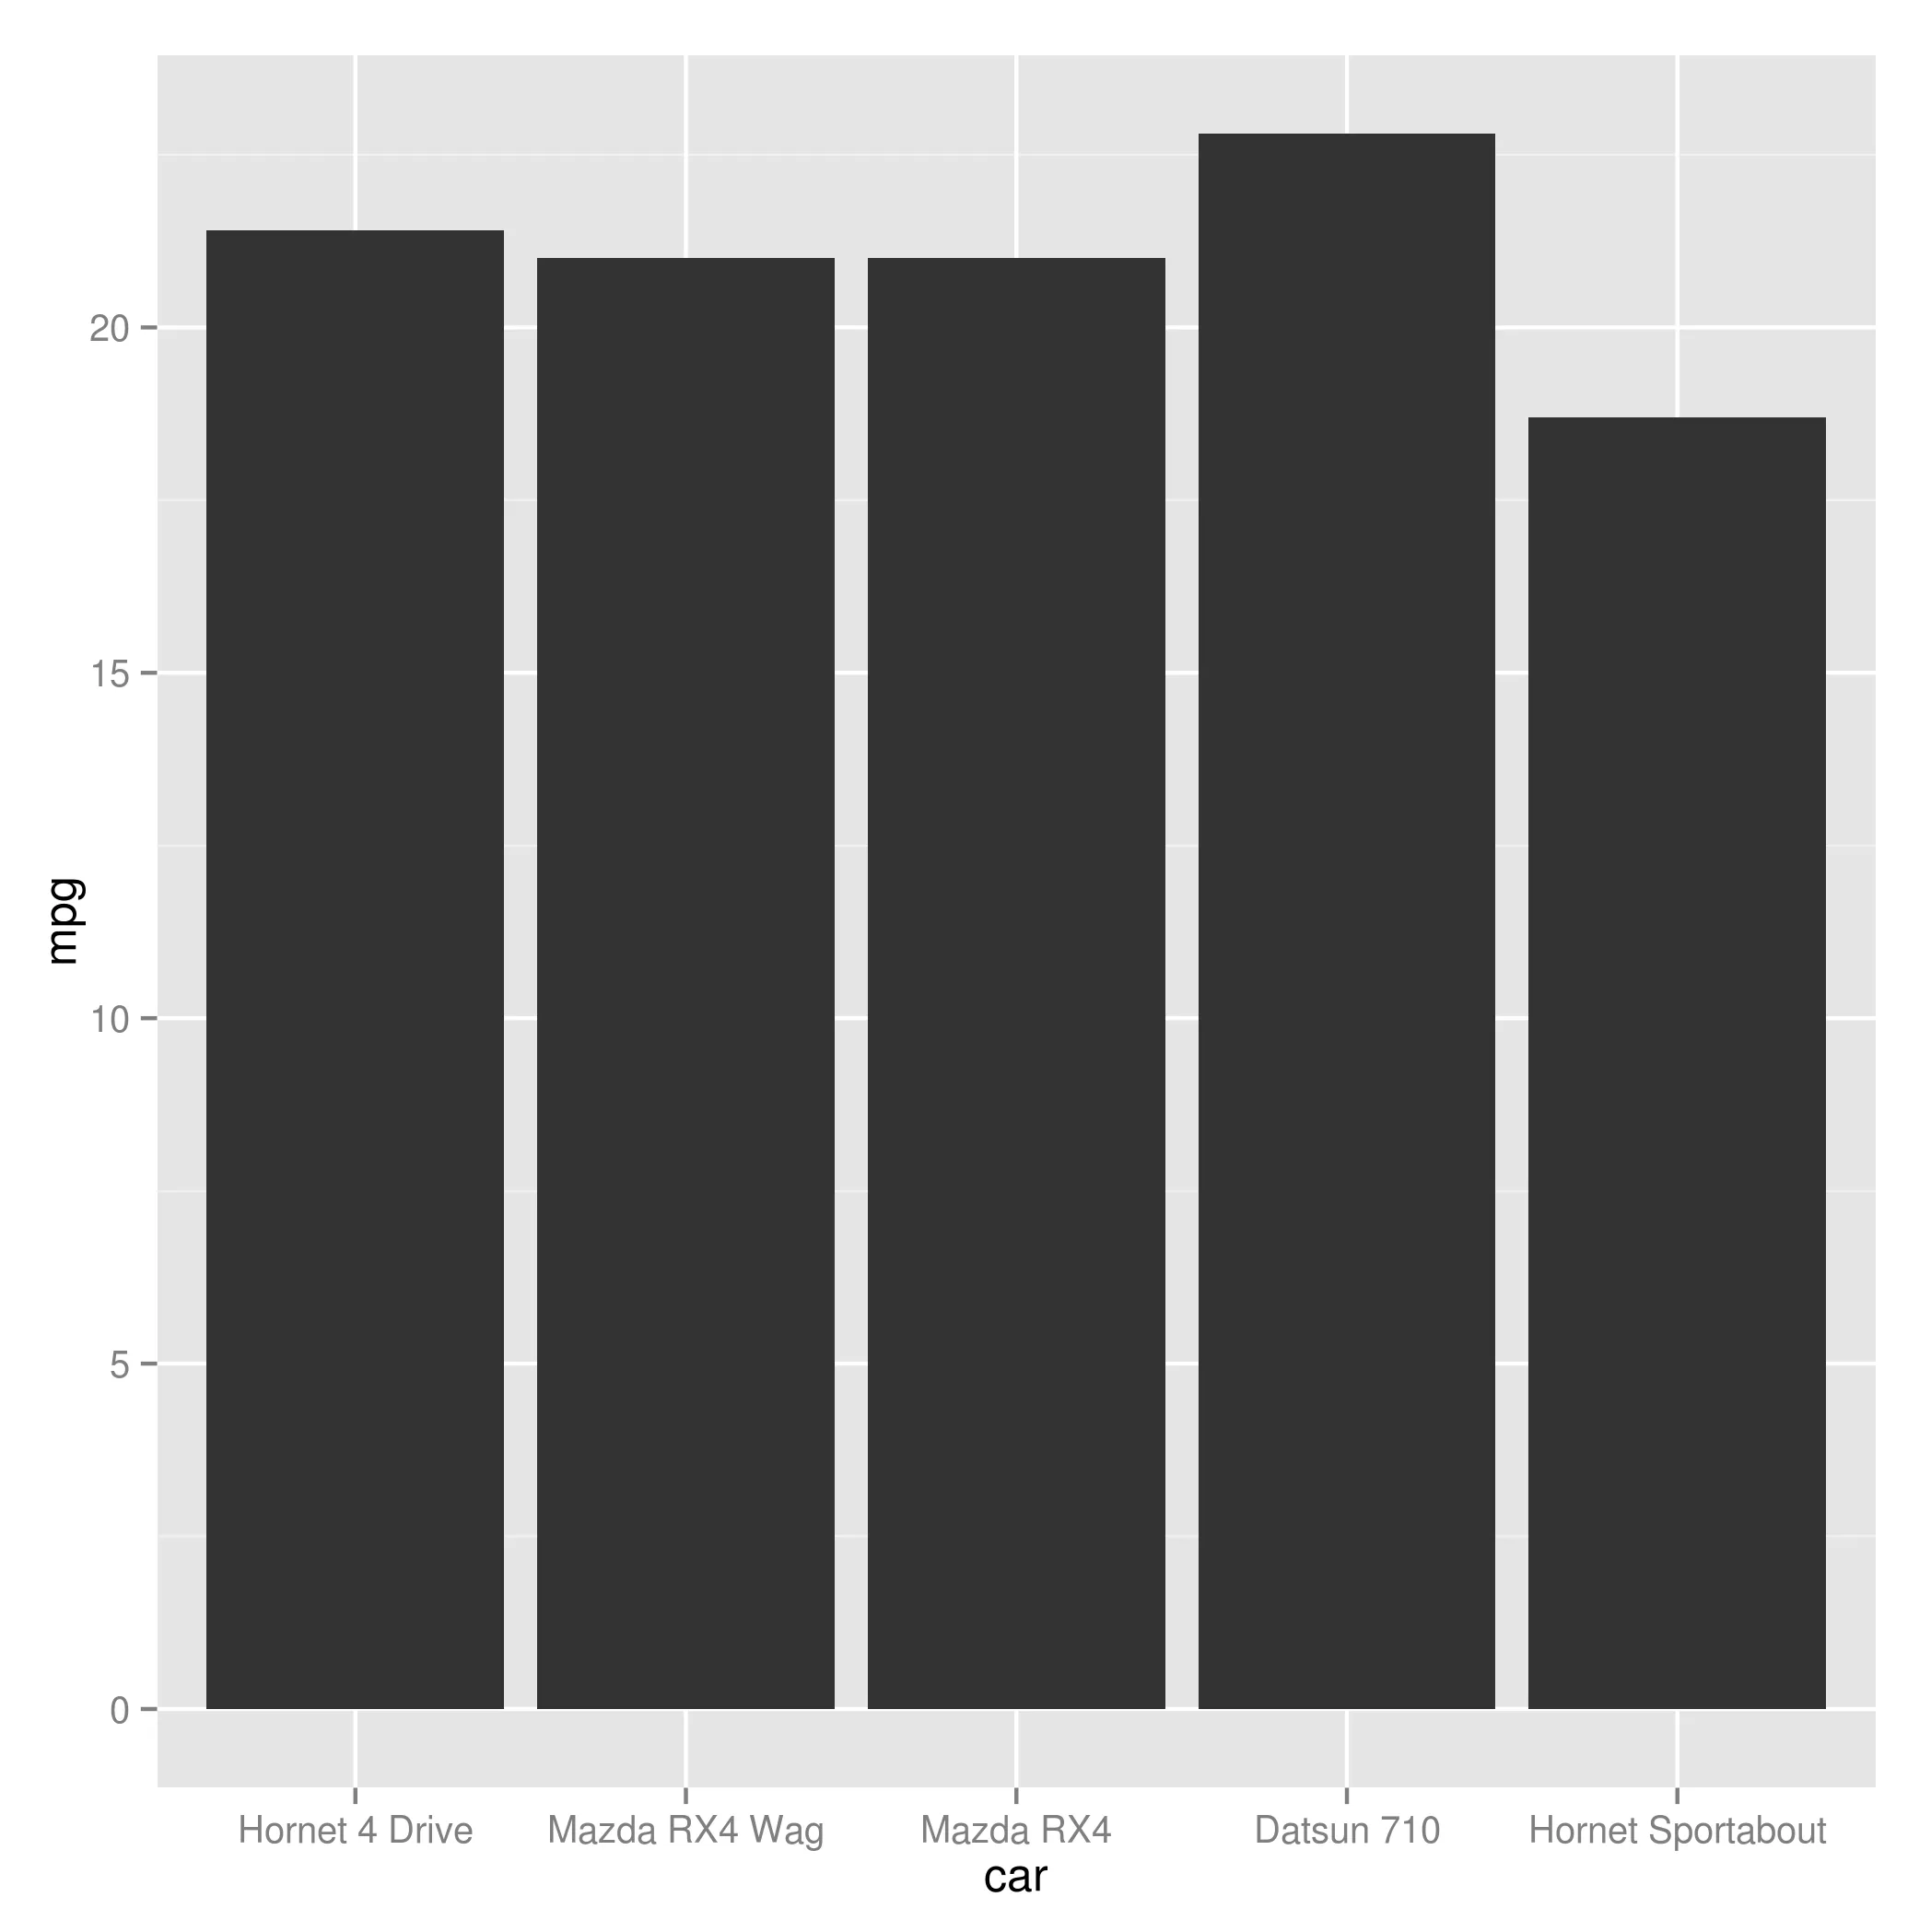
x轴的值按字母顺序排序。但如果我有一列汽车名单,我希望ggplot保留这个顺序怎么办:
#list out of alphabetical order
orderlist = c("Hornet 4 Drive", "Mazda RX4 Wag", "Mazda RX4",
               "Datsun 710", "Hornet Sportabout")

# I would like to plot the bar graph as above but preserve the plot order
# something like this:
p = ggplot(mtcars2, aes(x= reorder( car, orderlist), y=mpg))+ geom_bar(stat="identity")
任何指导都将不胜感激, zach cp