一张图中绘制两个紧密相邻的ggplot

3
我希望你能够使用geom_tile绘制填充等高线图,并将相应的原始轨迹直接放置在其下方,两者之间没有间隙。当使用gridExtra或cowplot时,我可以将它们靠近但无法使原始轨迹的顶部与填充等高线图的x轴重合。以下是详细信息:
数据:
library(reshape2)
library(ggplot2)
volcano=volcano
volcano3d=melt(volcano)
names(volcano3d) <- c("x", "y", "z")

图表

fill=ggplot(volcano3d,aes(x,y,z))+geom_tile(aes(fill=z))
raw=ggplot(volcano3d,aes(x,y))+geom_line()+theme(aspect.ratio=1/20)

我的尝试

library(gridExtra)
grid.arrange(fill,raw,heights=c(5,1)

虽然它们很接近,但我想做几件事情:
  1. 将底部轨迹向上移动,以便底部轨迹的顶部与等高线图的x轴相接触。
  2. 对齐两个轴,使0、25、50、75都对齐。在cowplot中,您可以使用align参数进行对齐,那么这很好,但我无法弄清如何将它们靠近彼此。
理想图

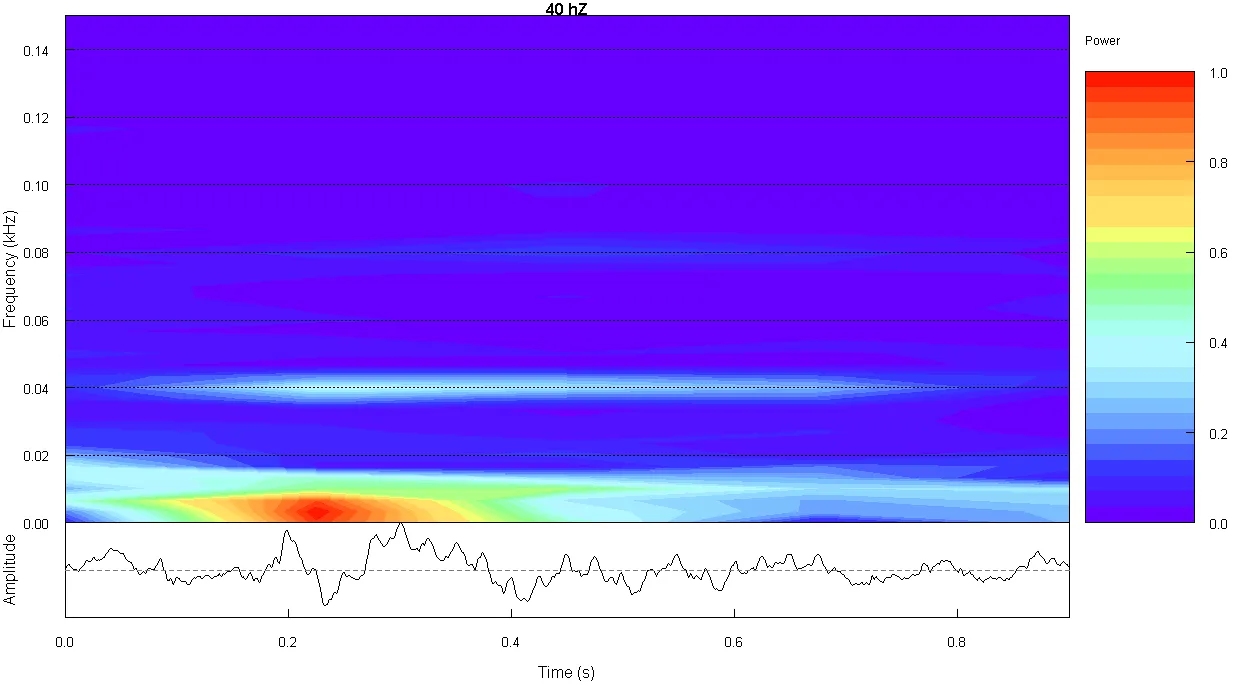
这来自另一个数据集,但它是布局的良好示例。 enter image description here

有什么想法?
2个回答

4

这可以让你接近你想要的东西,但图例在绘图区域内部。我使用theme(plot.margin)来调整绘图周围的上下间距并使轴对齐。expand=0允许数据扩展到绘图边缘(与您的示例相同)。创建每个图的grobs并将宽度设置为相等,允许您在arrangeGrob中控制高度和宽度。

library(reshape2)
library(ggplot2)
library(gridExtra)
library(grid)
volcano=volcano
volcano3d=melt(volcano)
names(volcano3d) <- c("x", "y", "z")

fill=ggplot(volcano3d,aes(x,y,z))+geom_tile(aes(fill=z)) + 
theme(axis.text.x = element_blank(),
    legend.position=c(1,1), 
    legend.justification=c(1, 1), 
    axis.title.x = element_blank(),axis.ticks=element_blank(),
    plot.margin = unit(c(1,1,0,1), "cm")) +
scale_x_continuous(expand = c(0, 0)) +
scale_y_continuous(expand = c(0, 0)) 
raw=ggplot(volcano3d,aes(x,y))+geom_line()+
theme(aspect.ratio=1/20,
    plot.margin = unit(c(-1.2,1,1,1), "cm")) +
 scale_x_continuous(expand = c(0, 0)) 

gA <- ggplotGrob(fill)
gB <- ggplotGrob(raw)
gA$widths <- gB$widths
grid.newpage()
grid.draw(arrangeGrob(gA,gB, heights = c(4/5, 1/5)) )

完美。图表内部的图例对我的同事来说应该没问题...如果有问题,他们可以处理。 - Ted Mosby

2
可以将图例放在图形外面。对于两个gtable,gA有一个额外的列来存放图例。因此,需要为gB添加一列,宽度与gA的图例相同。
另外,建议从gtables中删除相关的顶部和底部边距行。
library(reshape2)
library(ggplot2)
library(gridExtra)
library(gtable)
library(grid)
volcano=volcano
volcano3d=melt(volcano)
names(volcano3d) <- c("x", "y", "z")

fill = ggplot(volcano3d, aes(x, y, z)) +
   geom_tile(aes(fill=z)) + 
  scale_x_continuous(expand = c(0, 0)) +
  scale_y_continuous(expand = c(0, 0)) 

raw = ggplot(volcano3d,aes(x,y)) +
  geom_line() +
  scale_x_continuous(expand = c(0, 0)) 

gA <- ggplotGrob(fill)
gB <- ggplotGrob(raw)

ga = gA[-c(10:7), ]  # Remove bottom rows from gA
gb = gB[-c(1:5), ]   # Remove top rows from gB

# Add extra column to gB gtable
gb = gtable_add_cols(gb, ga$widths[7:8], 6)

ga$widths <- gb$widths
grid.newpage()
grid.draw(arrangeGrob(ga,gb, heights = c(4/5, 1/5)) )

网页内容由stack overflow 提供, 点击上面的
可以查看英文原文,
原文链接