我用 ggplot (ggplot + geom_bar) 创建了一个直方图,并添加了一条线:
+ geom_hline(aes(yintercept = 0.05), linetype = 'dashed')
我想在图例中添加一个条目,以指示虚线是预期值。
尽管在Stack Overflow上有类似的问题,但我找不到我需要的答案...
有什么办法可以做到这一点吗?
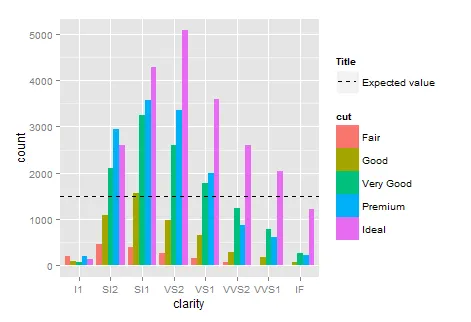
如果您有ggplot问题需要解决,制作可复制的示例非常方便,下次可以尝试这样做。以下是答案:
ggplot(diamonds, aes(clarity, fill = cut)) + geom_bar(position = "dodge") +
# linetype has to be aes; show_guide = TRUE is important
  geom_hline(aes(yintercept = 1500, linetype = "Expected value"),
             show_guide = TRUE) +
# 2 means dashed
  scale_linetype_manual("Title", values = 2) +
# This fixes some problems, try linetype = 1 and another legend will be ruined
  guides(fill = guide_legend(override.aes = list(linetype = 0)))