Matplotlib: 使用变量添加图例条目

3

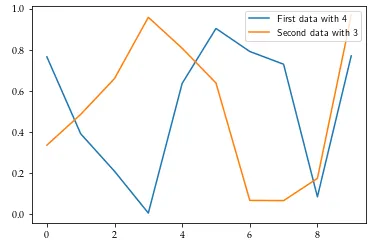
我是Python的初学者,如果这是一个非常基础的问题,请见谅。我希望根据输入变量显示图例条目。我已经搜索了解决方案,但是没有任何关于图例的教程涵盖了我的需求。最接近的匹配是这个plt.text的解决方案,它可以正常工作,但不适用于图例条目,请参见下面的代码示例。

from matplotlib import pyplot as plt
import numpy as np

input_var1 = 4
input_var2 = 3

y1 = np.random.rand(10)
y2 = np.random.rand(10)
x = np.linspace(0, 9, 10)

plt.plot(x, y1)
plt.plot(x, y2)

# Neither
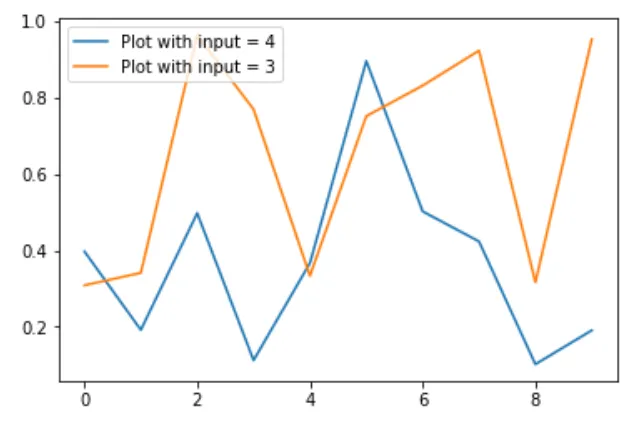
plt.legend("Plot with input = {}".format(input_var1))
# nor
plt.legend(f"Plot with input = {input_var1}")
# works

# but this works:
plt.text(2, 0.2, "Some text with variable = {}".format(input_var1))    

plt.show()

我错过了什么?
3个回答

6
你需要将可迭代对象传递给 legend,由于你有两个图表,请传递两个图例条目:
plt.legend(["First data with {}".format(input_var1),"Second data with {}".format(input_var2)])

这是绘制的图形: `enter image description here`

谢谢!是的,我为了易读性缩短了我的代码行,不应该这样做。核心错误是缺少方括号。 - undefined

3
不必创建图例,通过指定绘图的标签即可实现变量支持,通过设置它并调用plt.legend()可以实现。
plt.plot(x, y1, label="Plot with input = {}".format(input_var1))
plt.plot(x, y2, label="Plot with input = {}".format(input_var2))

plt.legend()
plt.show()

enter image description here


我忘了提到,我也尝试了你的方法。在这种情况下,我只是不知道我还需要调用plt.legend()。如果我可以将两个答案都标记为被接受的答案,我会这样做的。 - undefined
我的回答是基本形式,我将使用@jf_的示例来进行定制。 - undefined

2

这对我也有效:

str1 = 'Plot with input =' + str(input_var1)
str2 = 'Plot with input =' + str(input_var2)
plt.legend([str1,str2])

网页内容由stack overflow 提供, 点击上面的
可以查看英文原文,
原文链接