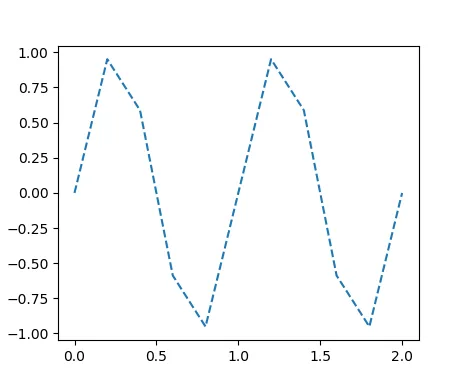
我只是想使用seaborn绘制一条虚线。 这是我正在使用的代码以及我得到的输出。
import seaborn as sns
import numpy as np
import matplotlib.pyplot as plt

n = 11
x = np.linspace(0,2,n)
y = np.sin(2*np.pi*x)

sns.lineplot(x,y, linestyle='--')
plt.show()

我做错了什么?谢谢
我只是想使用seaborn绘制一条虚线。 这是我正在使用的代码以及我得到的输出。
import seaborn as sns
import numpy as np
import matplotlib.pyplot as plt
n = 11
x = np.linspace(0,2,n)
y = np.sin(2*np.pi*x)
sns.lineplot(x,y, linestyle='--')
plt.show()
我做错了什么?谢谢
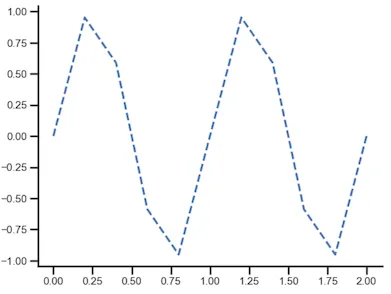
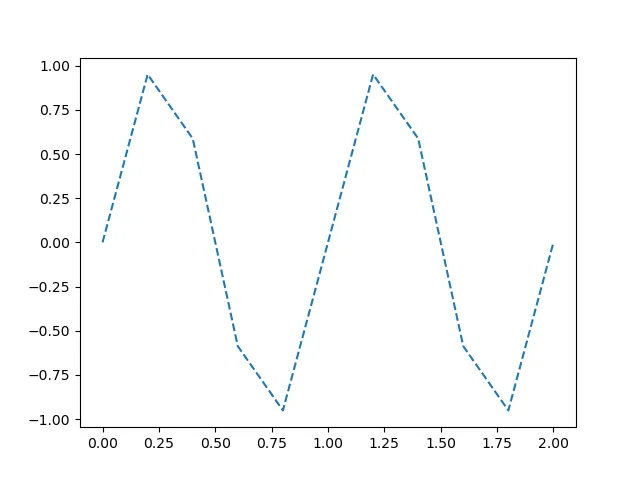
似乎在使用lineplot()时,linestyle=参数不起作用,而参数dashes=比看起来更加复杂。
一个(相对)简单的方法可能是使用ax.lines获取绘图中的Line2D对象列表,然后手动设置线型:
import seaborn as sns
import numpy as np
import matplotlib.pyplot as plt

n = 11
x = np.linspace(0,2,n)
y = np.sin(2*np.pi*x)

ax = sns.lineplot(x,y)

# Might need to loop through the list if there are multiple lines on the plot
ax.lines[0].set_linestyle("--")

plt.show()
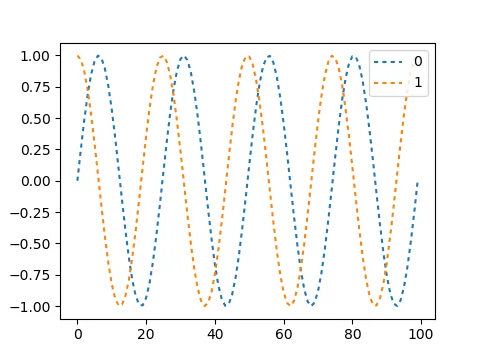
更新:
看起来dashes参数只适用于绘制多条线(通常使用 pandas 数据帧)。破折号的指定方式与 matplotlib 相同,是一个由(线段长度,间隙长度)组成的元组。因此,您需要传递一个元组列表。
n = 100
x = np.linspace(0,4,n)
y1 = np.sin(2*np.pi*x)
y2 = np.cos(2*np.pi*x)

df = pd.DataFrame(np.c_[y1, y2]) # modified @Elliots dataframe production

ax = sns.lineplot(data=df, dashes=[(2, 2), (2, 2)])
plt.show()
style参数才能使其正常工作。请参见:https://dev59.com/1VMH5IYBdhLWcg3w8l6b - Archie在当前版本的seaborn 0.11.1中,你的代码完全正常运行。
import seaborn as sns
import numpy as np
import matplotlib.pyplot as plt

n = 11
x = np.linspace(0,2,n)
y = np.sin(2*np.pi*x)

sns.lineplot(x=x,y=y, linestyle='--')
plt.show();
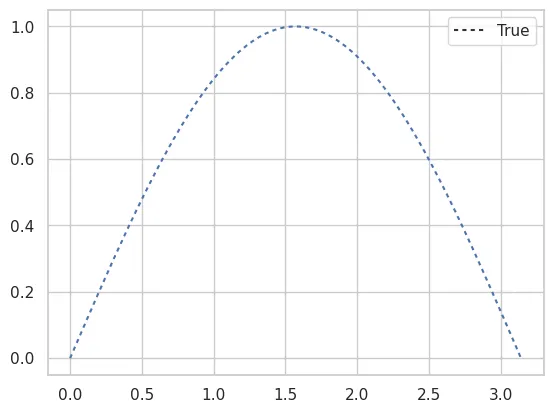
style=True,则它会广播到所有数据。现在我们只需要将dashes设置为所需的虚线元组(遗憾的是,“简单”虚线规范例如“--”,“:”或“dotted”不受支持),例如dashes=[(2,2)]:import seaborn as sns
import numpy as np
x = np.linspace(0, np.pi, 111)
y = np.sin(x)
sns.lineplot(x, y, style=True, dashes=[(2,2)])
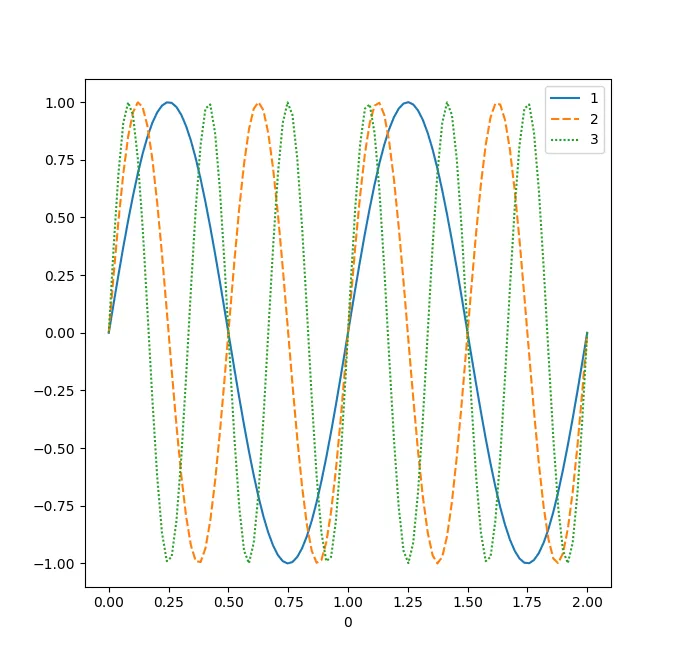
legend=False 传递给 sns.lineplot。 - Ben JWlineplot。对于您简化的情况,matplotlib的plot函数比seaborn更合适。 seaborn主要用于通过减少脚本直接干预来使图表更易读,通常在处理pandas数据框时效果最好。import seaborn as sns
import pandas as pd
import numpy as np
import matplotlib.pyplot as plt
n = 100
x = np.linspace(0,2,n)
y1 = np.sin(2*np.pi*x)
y2 = np.sin(4*np.pi*x)
y3 = np.sin(6*np.pi*x)
df = pd.DataFrame(np.c_[y1, y2, y3], index=x)
ax = sns.lineplot(data=df)
plt.show()
收益率
至于如何设置您想要显示的变量的样式,我不确定如何处理。
rc_context中。import seaborn as sns
import numpy as np
import matplotlib.pyplot as plt
n = 11
x = np.linspace(0,2,n)
y = np.sin(2*np.pi*x)
with plt.rc_context({'lines.linestyle': '--'}):
sns.lineplot(x, y)
plt.show()
[k for k in plt.rcParams.keys() if k.startswith('lines')]
matplotlib.pyplot,为什么不直接使用plt.plot(x,y, '--')呢? - Sheldore