假设我有以下字典:
如您所见,该字典由一系列字符串值及其频率组成。我想将其绘制成直方图,但不知道如何将字符串转换为 pandas 或 plotly 可读取的形式。您的方法是什么?或者有没有更简单的方法,而不是硬编码?或者,使用其他模块是否更容易实现?谢谢!
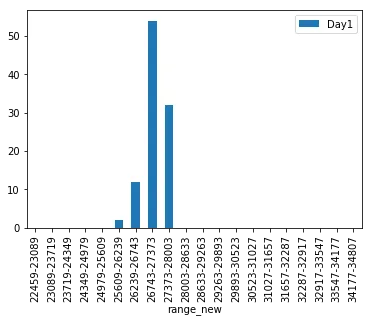
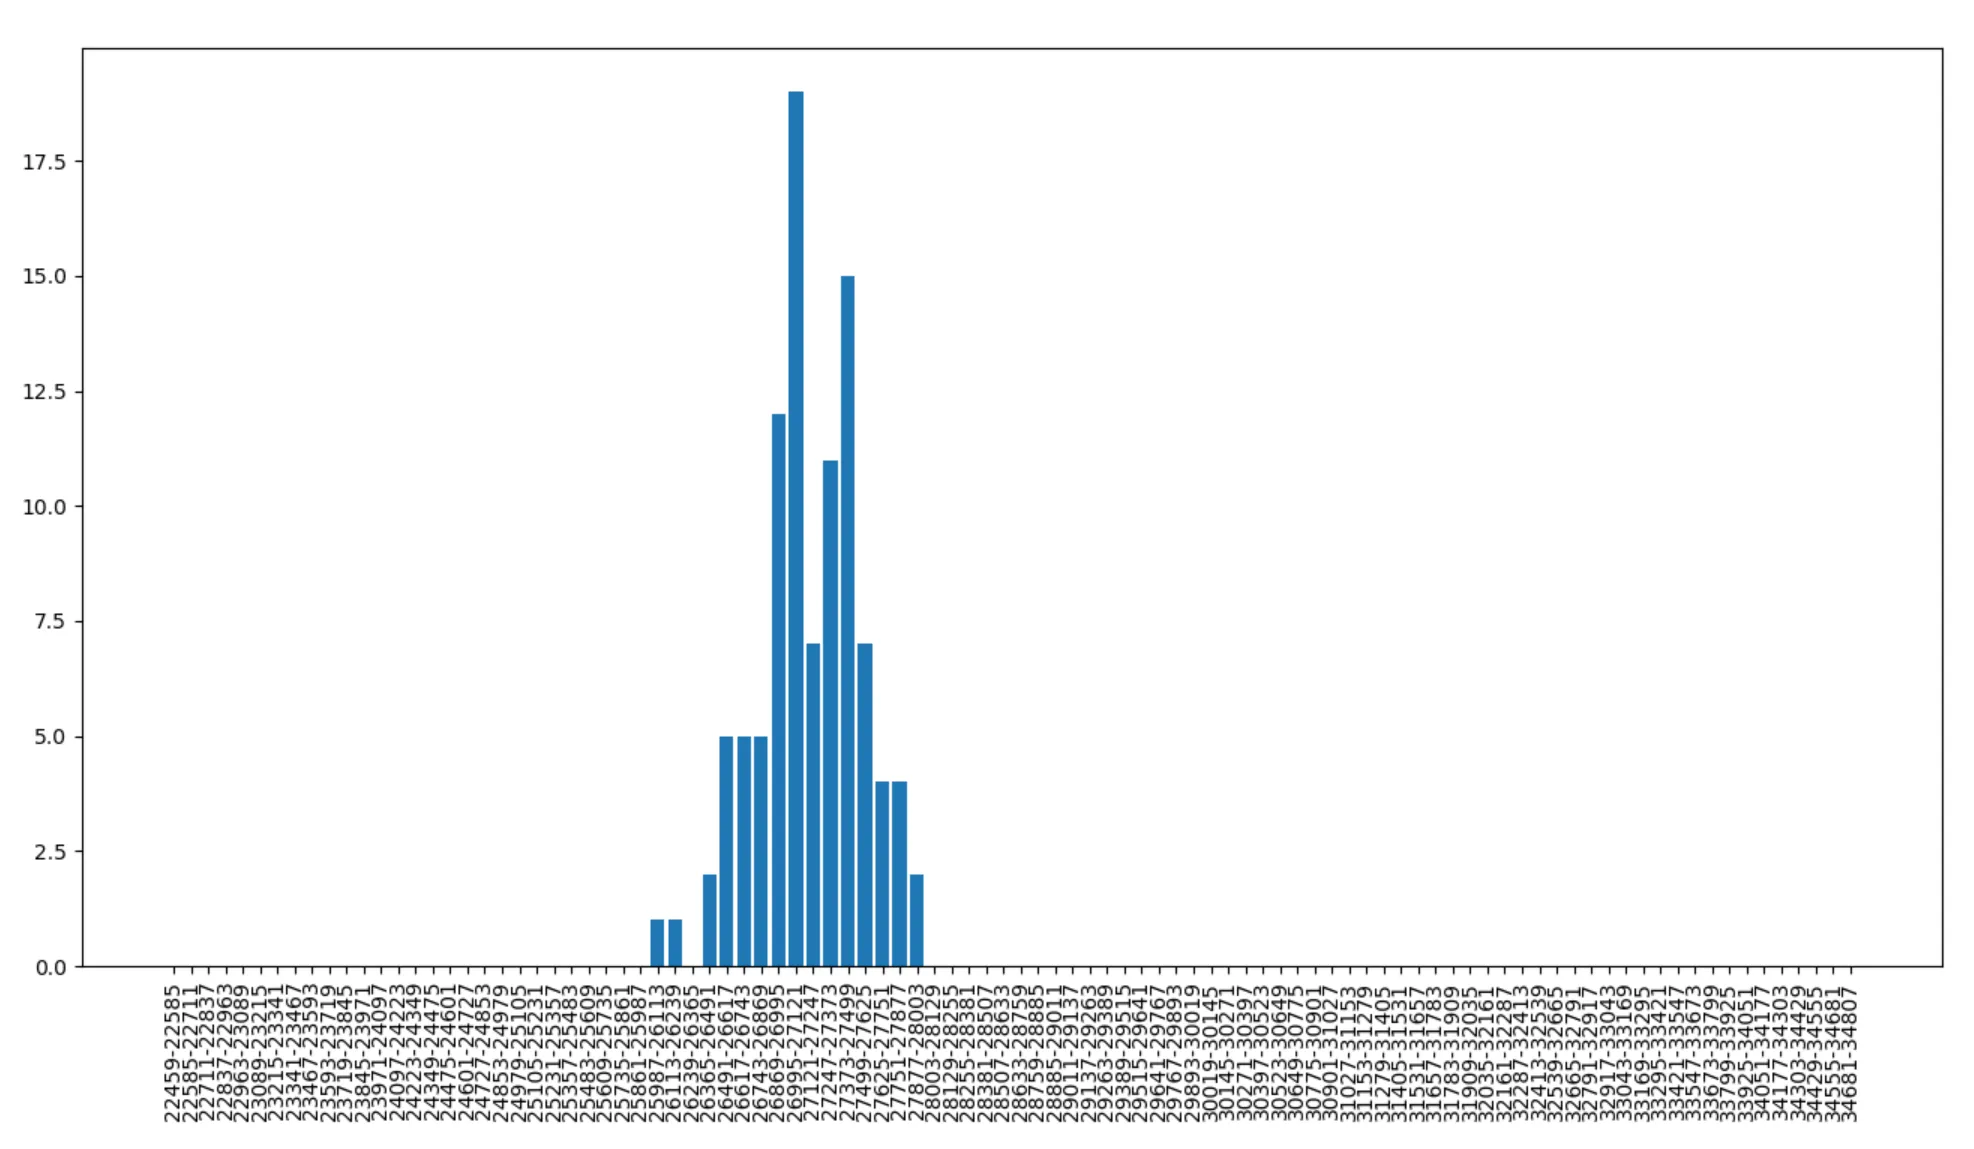
scenario_summary = {'Day1': {'22459-22585': 0.0, '22585-22711': 0.0, '22711-22837': 0.0, '22837-22963': 0.0, '22963-23089': 0.0, '23089-23215': 0.0, '23215-23341': 0.0, '23341-23467': 0.0, '23467-23593': 0.0, '23593-23719': 0.0, '23719-23845': 0.0, '23845-23971': 0.0, '23971-24097': 0.0, '24097-24223': 0.0, '24223-24349': 0.0, '24349-24475': 0.0, '24475-24601': 0.0, '24601-24727': 0.0, '24727-24853': 0.0, '24853-24979': 0.0, '24979-25105': 0.0, '25105-25231': 0.0, '25231-25357': 0.0, '25357-25483': 0.0, '25483-25609': 0.0, '25609-25735': 0.0, '25735-25861': 0.0, '25861-25987': 0.0, '25987-26113': 1.0, '26113-26239': 1.0, '26239-26365': 0.0, '26365-26491': 2.0, '26491-26617': 5.0, '26617-26743': 5.0, '26743-26869': 5.0, '26869-26995': 12.0, '26995-27121': 19.0, '27121-27247': 7.000000000000001, '27247-27373': 11.0, '27373-27499': 15.0, '27499-27625': 7.000000000000001, '27625-27751': 4.0, '27751-27877': 4.0, '27877-28003': 2.0, '28003-28129': 0.0, '28129-28255': 0.0, '28255-28381': 0.0, '28381-28507': 0.0, '28507-28633': 0.0, '28633-28759': 0.0, '28759-28885': 0.0, '28885-29011': 0.0, '29011-29137': 0.0, '29137-29263': 0.0, '29263-29389': 0.0, '29389-29515': 0.0, '29515-29641': 0.0, '29641-29767': 0.0, '29767-29893': 0.0, '29893-30019': 0.0, '30019-30145': 0.0, '30145-30271': 0.0, '30271-30397': 0.0, '30397-30523': 0.0, '30523-30649': 0.0, '30649-30775': 0.0, '30775-30901': 0.0, '30901-31027': 0.0, '31027-31153': 0.0, '31153-31279': 0.0, '31279-31405': 0.0, '31405-31531': 0.0, '31531-31657': 0.0, '31657-31783': 0.0, '31783-31909': 0.0, '31909-32035': 0.0, '32035-32161': 0.0, '32161-32287': 0.0, '32287-32413': 0.0, '32413-32539': 0.0, '32539-32665': 0.0, '32665-32791': 0.0, '32791-32917': 0.0, '32917-33043': 0.0, '33043-33169': 0.0, '33169-33295': 0.0, '33295-33421': 0.0, '33421-33547': 0.0, '33547-33673': 0.0, '33673-33799': 0.0, '33799-33925': 0.0, '33925-34051': 0.0, '34051-34177': 0.0, '34177-34303': 0.0, '34303-34429': 0.0, '34429-34555': 0.0, '34555-34681': 0.0, '34681-34807': 0.0}}
如您所见,该字典由一系列字符串值及其频率组成。我想将其绘制成直方图,但不知道如何将字符串转换为 pandas 或 plotly 可读取的形式。您的方法是什么?或者有没有更简单的方法,而不是硬编码?或者,使用其他模块是否更容易实现?谢谢!