绘制立方体

6

我正在尝试使用matplotlib绘制不同大小的立方体,使得:在旋转后,立方体不会以非物理方式重叠,立方体具有不同的颜色,并且周围有一个框。

我已经阅读了几篇博客文章和stackoverflow页面,引用了类似的问题,但总是有一些微小的差异;没有一个对我起作用。克服重叠问题最简单的方法是使用体素(如https://matplotlib.org/api/_as_gen/mpl_toolkits.mplot3d.axes3d.Axes3D.html?highlight=voxel#mpl_toolkits.mplot3d.axes3d.Axes3D.voxels),但这些不允许我在周围画框。在matplotlib中最简单的方法是什么?

下面的图像显示了我左侧的内容和我右侧想要的内容。

编辑: 我已经研究了几种可以实现所需效果的方法,其中主要方法包括:

  • 使用体素,但以某种方式缩放它们,使单个体素表示单个项目。
  • 使用表面绘图,然后动态调整绘制顺序以避免非物理重叠。

前者似乎更容易执行,但我仍然被难住了。

Left: what I get. Right: what I want


那么你面临的问题是体素在尺寸上总是1x1x1吗? - ImportanceOfBeingErnest
我已经想到了几种解决问题的方法,如果可以进行调整,那将是一种可能的解决方案。此外,这是一种解决方案,希望能够增加可扩展性;我希望能够将此可视化应用于数据集,其中边界域通常为[0,0,0]x[1000,1000,1000],而不必显式存储每个单元格将大大减少内存使用量。我想展示的约40个框架几乎从不小于10x10x10。通过任何其他方式在matplotlib中实现此可视化也可以(不仅仅是通过体素)。 - Knaapje
2个回答

11

A. 使用 Poly3DCollection

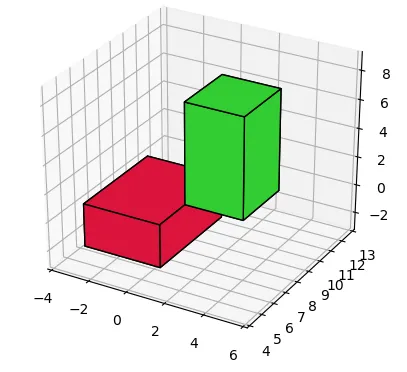
一种选择是创建立方体面的Poly3DCollection。由于相同集合的艺术家没有重叠问题,因此这可能最好地满足此处的目的。

from mpl_toolkits.mplot3d import Axes3D
from mpl_toolkits.mplot3d.art3d import Poly3DCollection
import numpy as np
import matplotlib.pyplot as plt

def cuboid_data2(o, size=(1,1,1)):
    X = [[[0, 1, 0], [0, 0, 0], [1, 0, 0], [1, 1, 0]],
         [[0, 0, 0], [0, 0, 1], [1, 0, 1], [1, 0, 0]],
         [[1, 0, 1], [1, 0, 0], [1, 1, 0], [1, 1, 1]],
         [[0, 0, 1], [0, 0, 0], [0, 1, 0], [0, 1, 1]],
         [[0, 1, 0], [0, 1, 1], [1, 1, 1], [1, 1, 0]],
         [[0, 1, 1], [0, 0, 1], [1, 0, 1], [1, 1, 1]]]
    X = np.array(X).astype(float)
    for i in range(3):
        X[:,:,i] *= size[i]
    X += np.array(o)
    return X

def plotCubeAt2(positions,sizes=None,colors=None, **kwargs):
    if not isinstance(colors,(list,np.ndarray)): colors=["C0"]*len(positions)
    if not isinstance(sizes,(list,np.ndarray)): sizes=[(1,1,1)]*len(positions)
    g = []
    for p,s,c in zip(positions,sizes,colors):
        g.append( cuboid_data2(p, size=s) )
    return Poly3DCollection(np.concatenate(g),  
                            facecolors=np.repeat(colors,6), **kwargs)
    

positions = [(-3,5,-2),(1,7,1)]
sizes = [(4,5,3), (3,3,7)]
colors = ["crimson","limegreen"]

fig = plt.figure()
ax = fig.gca(projection='3d')
ax.set_aspect('equal')

pc = plotCubeAt2(positions,sizes,colors=colors, edgecolor="k")
ax.add_collection3d(pc)    

ax.set_xlim([-4,6])
ax.set_ylim([4,13])
ax.set_zlim([-3,9])

plt.show()

这里输入图像描述

B. 使用plot_surface

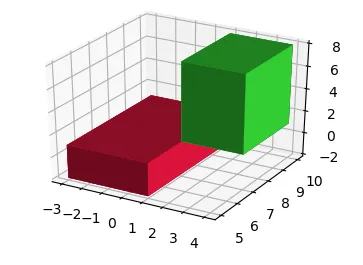
根据这个问题的解决方案,使用plot_surface,并允许根据需要设置不同的大小,对于大多数情况,似乎都能很好地工作:

from mpl_toolkits.mplot3d import Axes3D
import numpy as np
import matplotlib.pyplot as plt

def cuboid_data(o, size=(1,1,1)):
    # code taken from
    # https://dev59.com/U4vda4cB1Zd3GeqPdb-g#35978146
    # suppose axis direction: x: to left; y: to inside; z: to upper
    # get the length, width, and height
    l, w, h = size
    x = [[o[0], o[0] + l, o[0] + l, o[0], o[0]],  
         [o[0], o[0] + l, o[0] + l, o[0], o[0]],  
         [o[0], o[0] + l, o[0] + l, o[0], o[0]],  
         [o[0], o[0] + l, o[0] + l, o[0], o[0]]]  
    y = [[o[1], o[1], o[1] + w, o[1] + w, o[1]],  
         [o[1], o[1], o[1] + w, o[1] + w, o[1]],  
         [o[1], o[1], o[1], o[1], o[1]],          
         [o[1] + w, o[1] + w, o[1] + w, o[1] + w, o[1] + w]]   
    z = [[o[2], o[2], o[2], o[2], o[2]],                       
         [o[2] + h, o[2] + h, o[2] + h, o[2] + h, o[2] + h],   
         [o[2], o[2], o[2] + h, o[2] + h, o[2]],               
         [o[2], o[2], o[2] + h, o[2] + h, o[2]]]               
    return np.array(x), np.array(y), np.array(z)

def plotCubeAt(pos=(0,0,0), size=(1,1,1), ax=None,**kwargs):
    # Plotting a cube element at position pos
    if ax !=None:
        X, Y, Z = cuboid_data( pos, size )
        ax.plot_surface(X, Y, Z, rstride=1, cstride=1, **kwargs)

positions = [(-3,5,-2),(1,7,1)]
sizes = [(4,5,3), (3,3,7)]
colors = ["crimson","limegreen"]


fig = plt.figure()
ax = fig.gca(projection='3d')
ax.set_aspect('equal')

for p,s,c in zip(positions,sizes,colors):
    plotCubeAt(pos=p, size=s, ax=ax, color=c)

plt.show()

输入图像描述


对于这段代码,我提到的不自然重叠在某些方向上发生。 - Knaapje
使用Matplotlib版本2.2.0,我获得了以下行为:https://imgur.com/a/PME5J - Knaapje
我最终使用了另一个库。VPython 运行得很好,并且安装也很容易。 - Knaapje
2
注意:ax.set_aspect('equal')不再受支持(https://github.com/matplotlib/matplotlib/issues/15382#issuecomment-595195723),请改用`ax.set_box_aspect((1, 1, 1))`。 - Adi Shavit
fig.gca(projection='3d') 应该改为 ax = plt.figure().add_subplot(projection="3d")。 在 Matplotlib 3.4 中,使用关键字参数调用 gca() 已被弃用。从两个次要版本开始,gca() 将不再接受关键字参数。 - Janosh
显示剩余2条评论

2
以下代码不仅适用于长方体,还适用于任何多边形。 请分别输入 x、y 和 z 的坐标
import numpy as np
import matplotlib.pyplot as plt
from mpl_toolkits.mplot3d import axes3d
from mpl_toolkits.mplot3d.art3d import Poly3DCollection

#input values
x=[1,10,50,100,150]
y=[1,300,350,250,50]
z=[0,1]
def edgecoord(pointx,pointy,pointz):
    edgex=[pointx[0],pointx[1],pointx[1],pointx[0]]
    edgey=[pointy[0],pointy[1],pointy[1],pointy[0]]
    edgez=[pointz[0],pointz[0],pointz[1],pointz[1]]
    return list(zip(edgex,edgey,edgez))

def coordConvert(x,y,lheight,uheight):
    if len(x) != len(y) and len(x)>2:
        return
    vertices=[]
    #Top layer
    vertices.append(list(zip(x,y,list(np.full(len(x),uheight)))))
    # Side layers
    for it in np.arange(len(x)):
        it1=it+1
        if it1>=len(x):
            it1=0
        vertices.append(edgecoord([x[it],x[it1]],[y[it],y[it1]],[lheight,uheight]))
    #Bottom layer
    vertices.append(list(zip(x,y,list(np.full(len(x),lheight)))))
    print(np.array(vertices))
    return vertices

vec=coordConvert(x,y,z[0],z[1])

plt.figure()
plt.subplot(111,projection='3d')
plt.gca().add_collection3d(Poly3DCollection(vec, alpha=.75,edgecolor='k', facecolor='teal'))
plt.xlim([0,200])
plt.ylim([0,400])
plt.show()

多边形棱镜

(与IT技术无关)

网页内容由stack overflow 提供, 点击上面的
可以查看英文原文,
原文链接