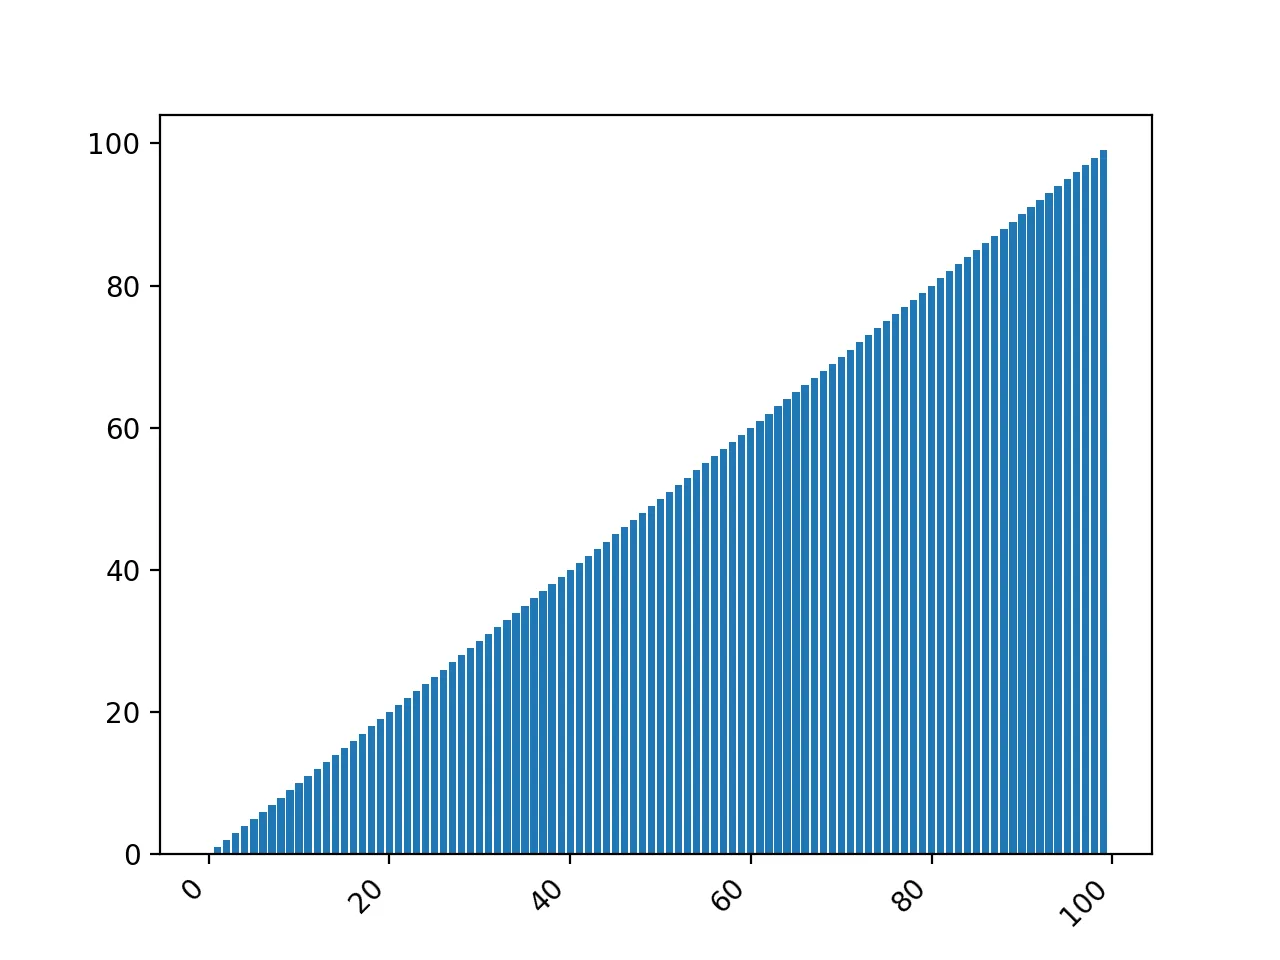
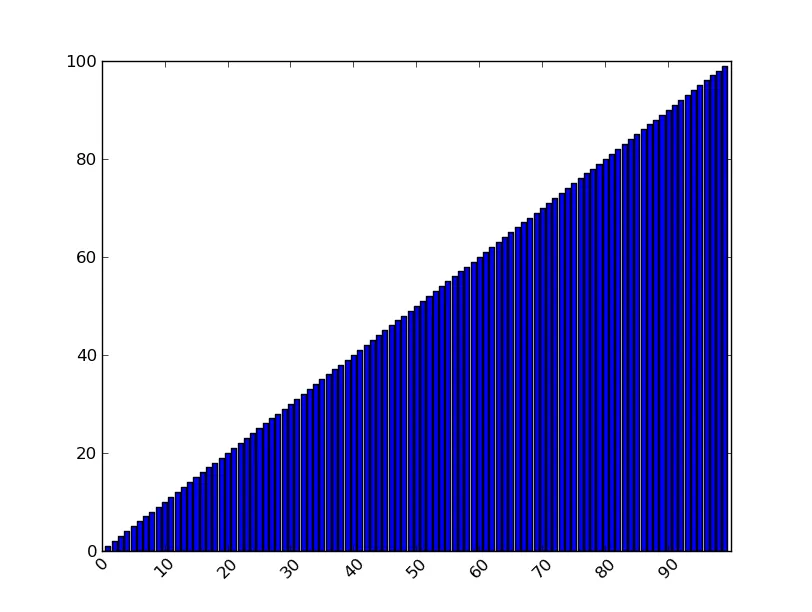
我正在使用matplotlib.pyplot在Python中绘制条形图。该图表将包含大量的条形,每个条形都有自己的标签。因此,标签会重叠,不再可读。我希望标签以对角线显示,以便它们不会重叠,就像this图片中一样。
这是我的代码:
import matplotlib.pyplot as plt
N =100
menMeans = range(N)
ind = range(N)
ticks = ind
fig = plt.figure()
ax = fig.add_subplot(111)
rects1 = ax.bar(ind, menMeans, align = 'center')
ax.set_xticks(ind)
ax.set_xticklabels( range(N) )
plt.show()
如何将标签以对角线方式显示?
ax.bar现在可以接受tick_label参数。 - information_interchange