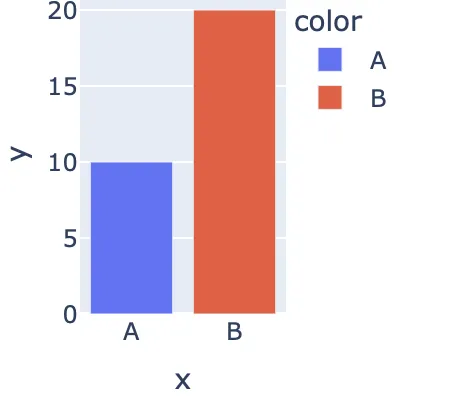
设置绘图区域的大小。

4

让我们来看一个简单的例子:

import plotly.express as px
x = ['A', 'B']
y = [10, 20]
fig = px.bar(x=x, y=y, color=x)
fig.update_layout(autosize=False, width=300, height=300, showlegend=True)
fig.show()

result 
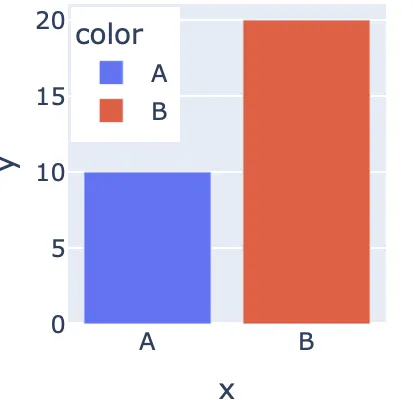
我将宽度和高度设置成同样的值,但结果却不同。我理解这是因为坐标轴刻度、标签和图例所占用的空间。那么如何设置绘图区域的大小呢?比如我想要一个正方形图形,我该怎么做?
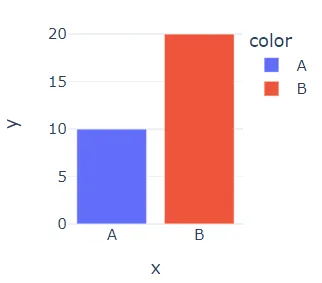
我尝试添加:

fig.update_yaxes(
    scaleanchor = "x",
    scaleratio = 1,
)

但这并没有改变结果。有什么想法吗?

1个回答

2
将图例放置在图表区域内是一种选择。
import plotly.express as px
x = ['A', 'B']
y = [10, 20]
fig = px.bar(x=x, y=y, color=x)
fig.update_layout(autosize=False, width=200, height=200, showlegend=True, margin={"l":0,"r":0,"t":0,"b":0})
fig.show()
fig.update_layout(legend=dict(
    yanchor="top",
    y=0.99,
    xanchor="left",
    x=0.01
))
fig.show()

enter image description here enter image description here


1
谢谢,但我不想在绘图区域中显示图例...此外,轴标签仍会影响绘图区域的大小。因此,如果有更好的答案,我会等待它的出现。 - soungalo

网页内容由stack overflow 提供, 点击上面的
可以查看英文原文,
原文链接