如何设置igraph绘图的大小?

6

我目前正在按照以下方式绘制我的图表:

        ig.plot(graph, target=file, vertex_color=membership,
            vertex_label=[index for index, value in enumerate(graph.vs)],
            vertex_frame_width=0,
            palette=ig.ClusterColoringPalette(len(set(membership)) + 3))

结果:

将图绘制到单页PDF文件中。虽然外观不错,但节点太拥挤了。有没有办法将节点拉开,以便我实际上可以看到所有的边缘? 我正在考虑增加图的大小,但我不知道如何做。
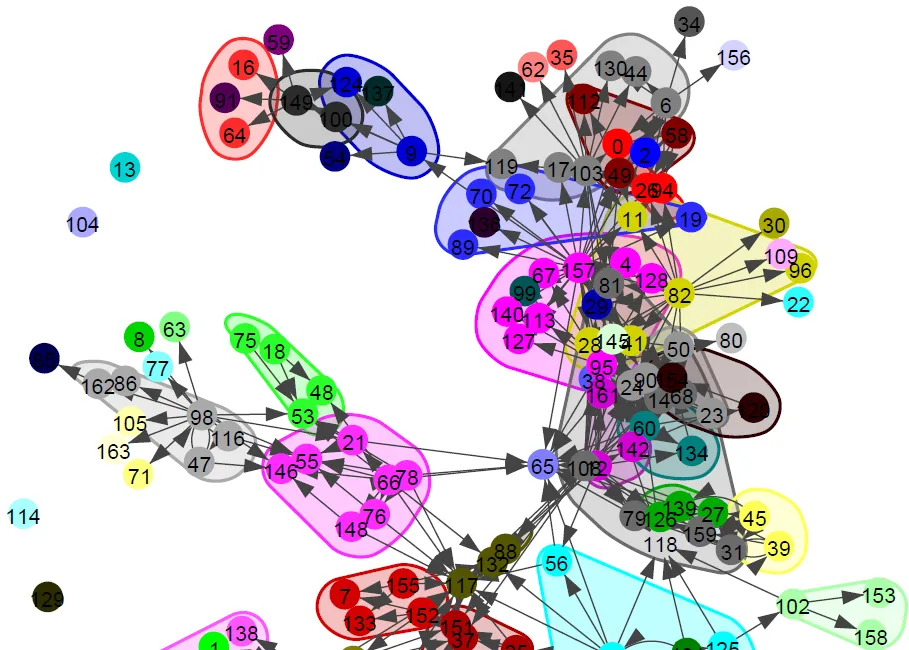
这是当前的样子:current plot


你是指设置边缘宽度吗?那有什么帮助呢? - Alex G.
在重新考虑后,使用布局选项来设置盒子的大小。 - Rachel Gallen
1个回答

9
从这个python igraph教程
布局对象还包含一些有用的方法,可以批量地进行平移、缩放或旋转坐标。然而,布局对象的主要用途是您可以将它们与图形一起传递给plot()函数,以获得一个二维绘图。
visual_style = {}
visual_style["layout"] = g.layout()
visual_style["bbox"] = (300, 300)
visual_style["margin"] = 10
plot(g, **visual_style)

尝试了各种布局和变换后,我最终选择了layout_kamada_kawai。设置正确的bbox(即1024x1024)有助于将节点分开。谢谢! - Alex G.
@AlexG,很高兴能帮忙! :) 很高兴你找到了合适的。 - Rachel Gallen

网页内容由stack overflow 提供, 点击上面的
可以查看英文原文,
原文链接