Pandas - 如何用多列数据绘制非堆叠DataFrame的图表

4
我可以帮您翻译成中文。这是一个 Pandas 中的 DataFrame,当它被 unstacked 时它看起来像这样。
     Unique Sessions
Date      2016-06-21 2016-06-29
Name
ABCD             995      4,088
EFGH               8         25
OPEF               1          1

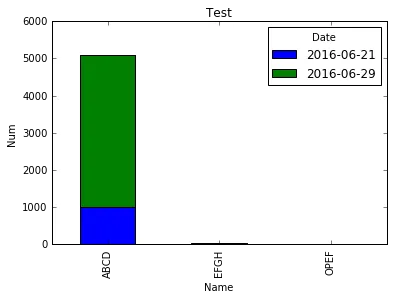
我该如何使用Pandas从这个DataFrame绘制堆叠条形图,使得x轴是名称,y轴是日期中的数字并且堆叠?
# df is the stacked DataFrame
plot = df.unstack().plot(kind='bar', stacked=True, title="Test")
plot.set_xlabel("Name")
plot.set_ylabel("Num")
plt.savefig('testplot.png', dpi=1000)

这段代码将创建一个条形图,但只考虑2016-06-21的数据,并不会将2016-06-29的数字堆叠在第21天的数据之上。
1个回答

0

设置

df = pd.DataFrame([[995, 4088], [8, 25], [1, 1]],
                  index=pd.Index(['ABCD', 'EFGH', 'OPEF'], name='Name'),
                  columns=pd.MultiIndex.from_product([['Unique Sessions'], ['2016-06-21', '2016-06-29']],
                                                     names=[None, 'Date']))

print df

     Unique Sessions           
Date      2016-06-21 2016-06-29
Name                           
ABCD             995       4088
EFGH               8         25
OPEF               1          1

我做了什么

plot = df['Unique Sessions'].plot.bar(stacked=True, title="Test")
plot.set_xlabel("Name")
plot.set_ylabel("Num")

enter image description here


奇怪,它在我的表格上不起作用,但当我手动输入你的时候它可以工作。 - DeadCake
只是一个想法... 4,088 中的逗号是什么意思? - piRSquared
是的,他们修复了它。只需在我的read_csv行中添加thousands=',',它就可以工作了。谢谢! - DeadCake

网页内容由stack overflow 提供, 点击上面的
可以查看英文原文,
原文链接