根据月份对ggplot的背景进行阴影处理

3

以下是代码:

df <- data.frame(day <- 0:365, value = 1)
library(ggplot2)
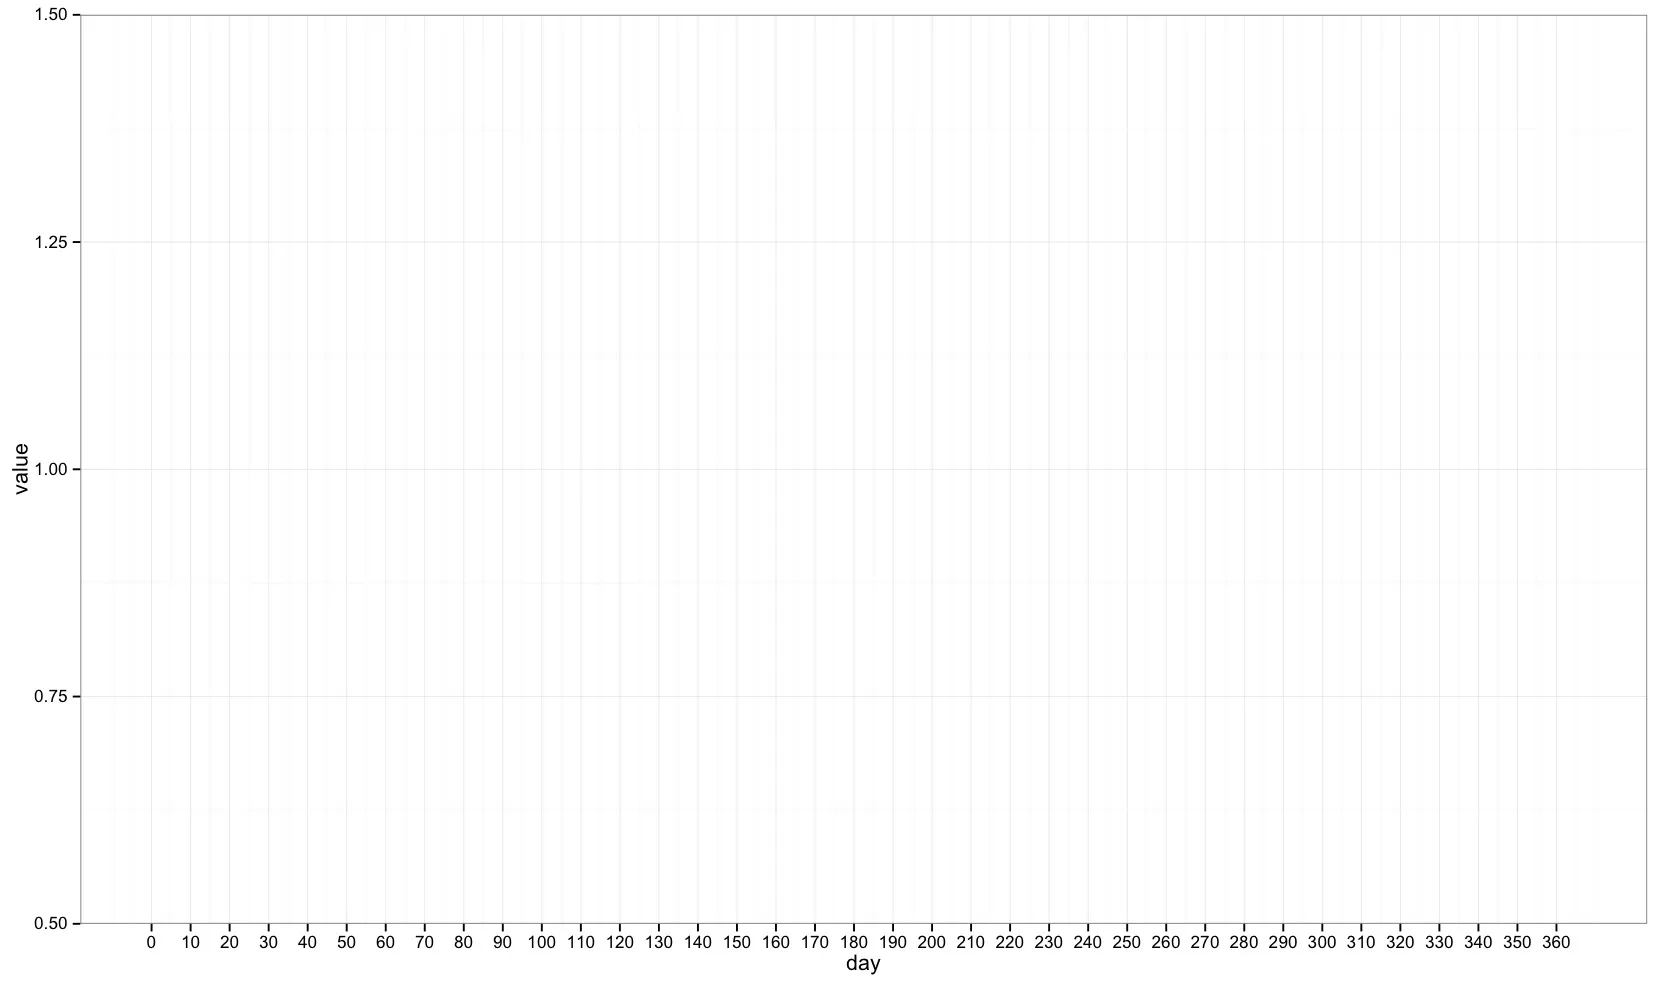
ggplot(df, aes(day, value)) + geom_blank() + scale_x_continuous(breaks = seq(0, 365, 10)) + theme_bw()

生成这个图:

enter image description here

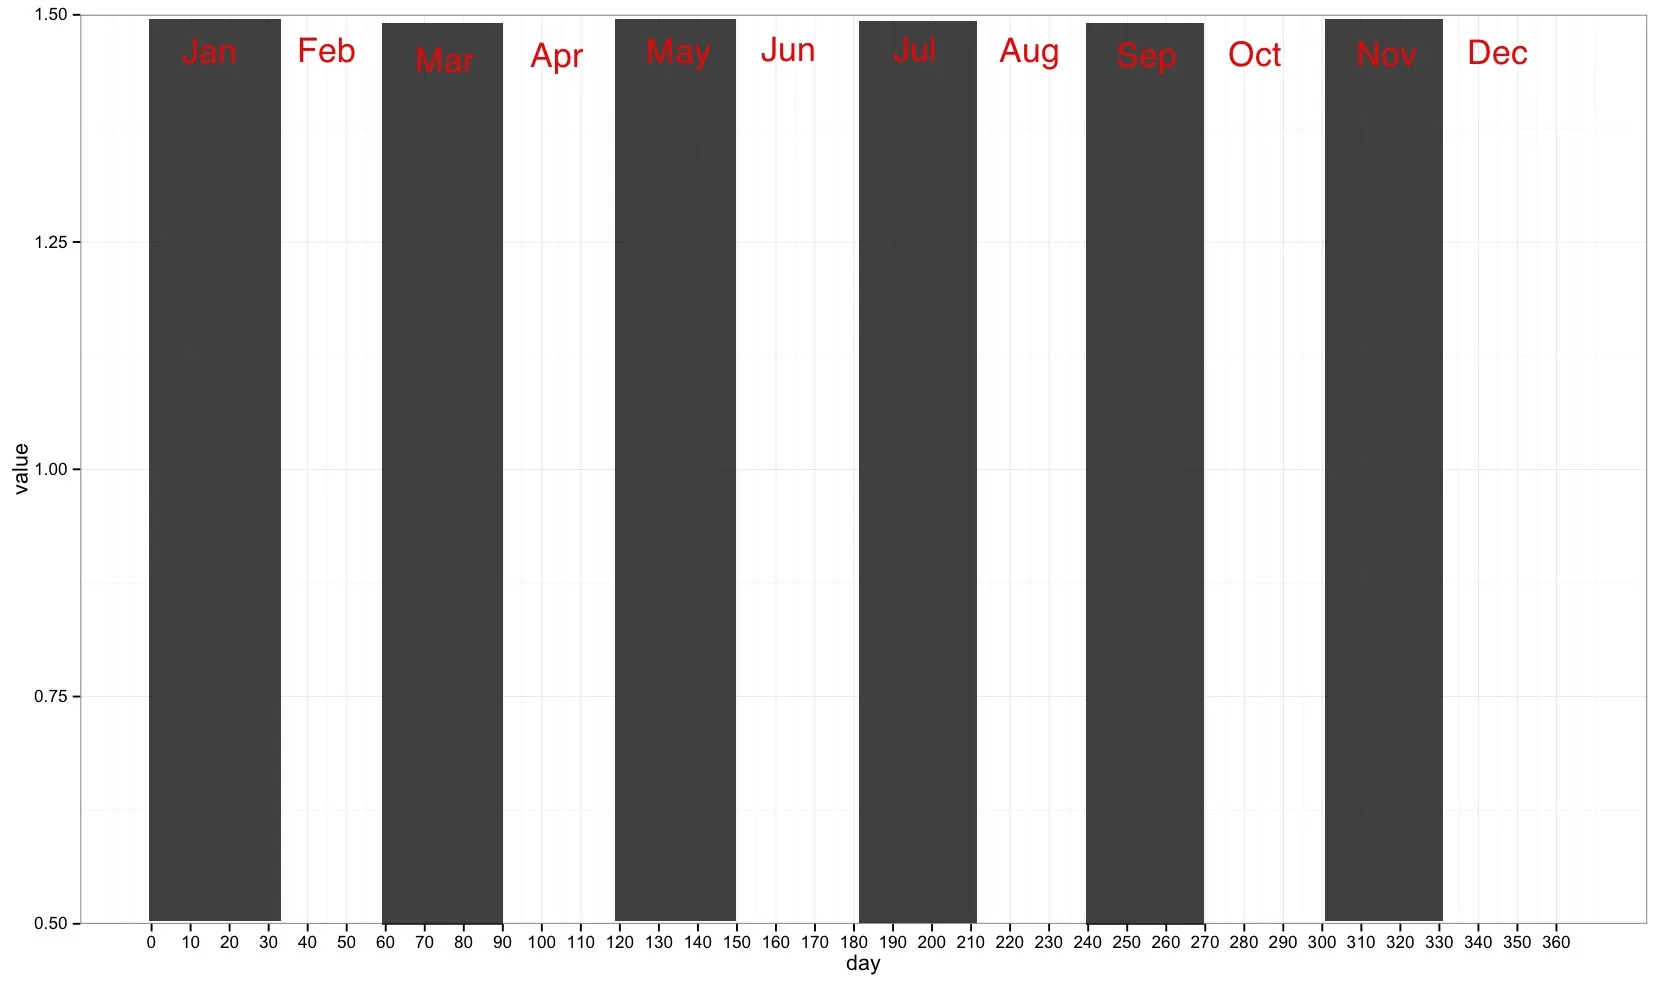
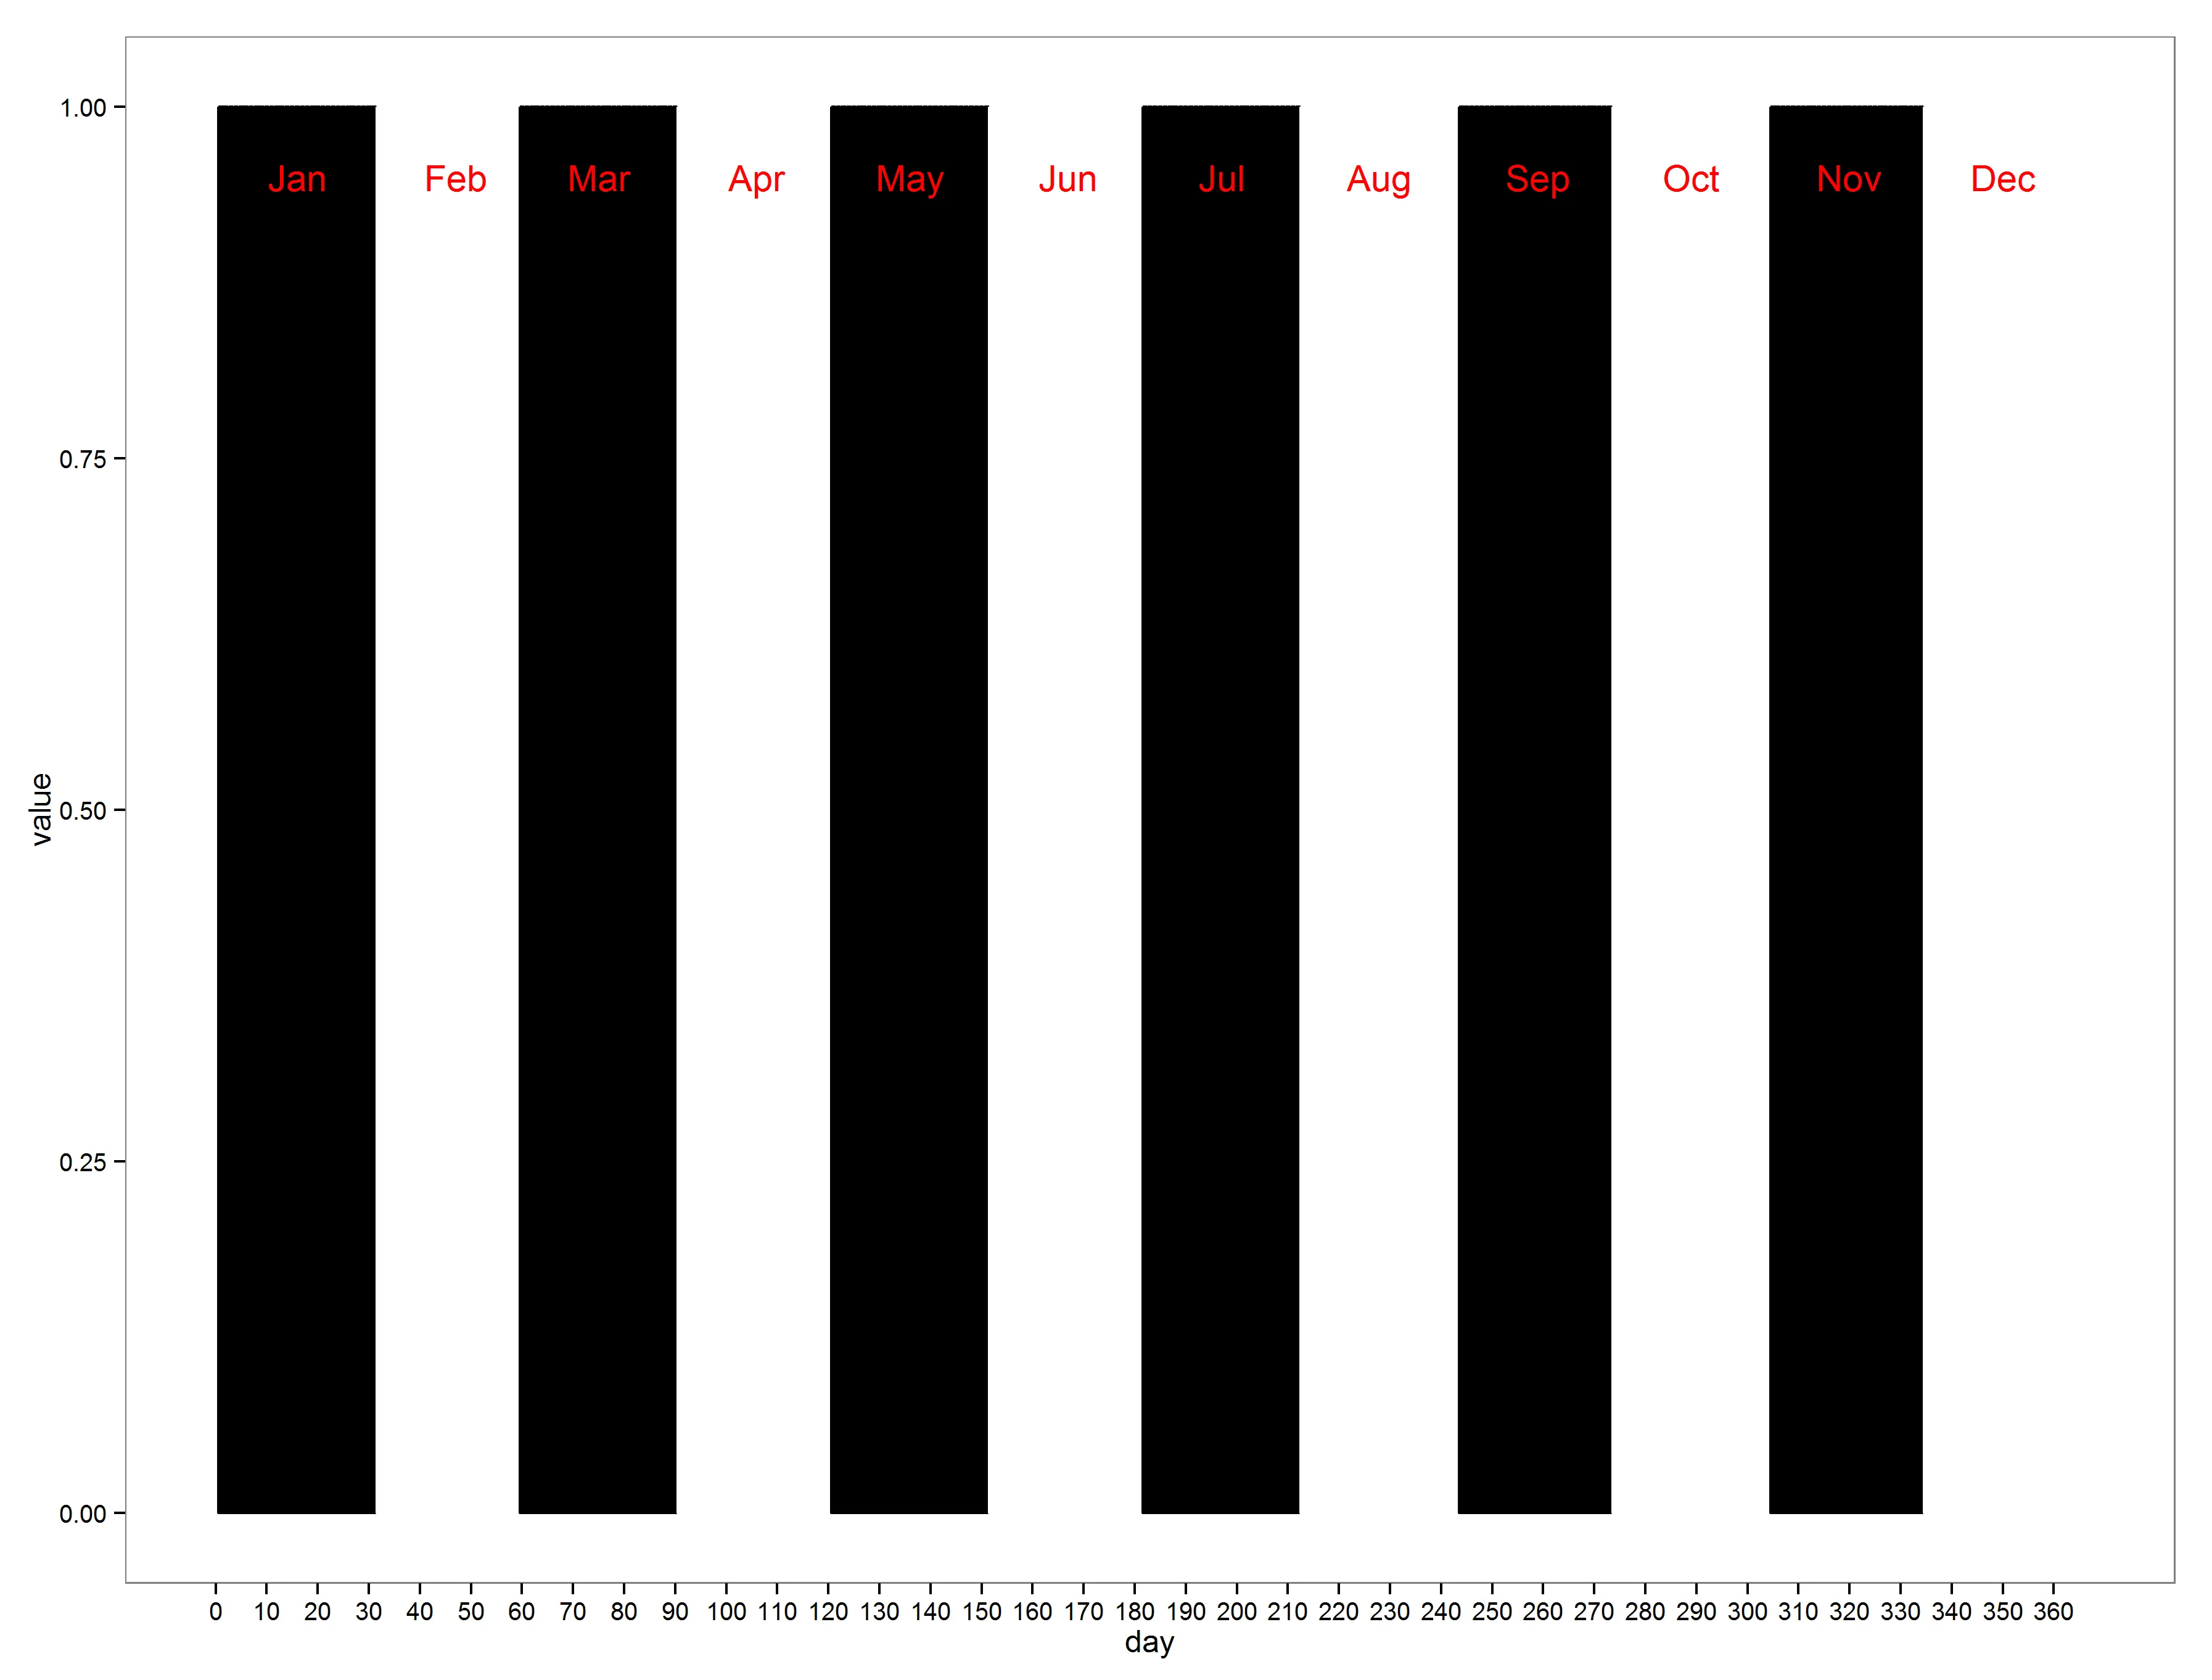
使用R代码,我想根据day属于哪个月份来对图的背景进行着色。 我希望绘图看起来像下面这样(图片的背景经过Photoshop处理)。 我特别希望使用lubridate解决此问题。

enter image description here

2个回答

6
这是使用geom_raster的部分解决方案。
library(lubridate)
library(ggplot2)

x <- seq(from = as.Date("2000/1/1"), to = as.Date("2000/12/31"), "day")
xy <- data.frame(datum = x, day = day(x), month = month(x), seq.day = 1:length(x), 
                 month.ind = rep(rep(0:1, 6), times = rle(xy$month)$lengths))

ggplot(xy, aes(x = seq.day, y = 1, fill = as.factor(month.ind))) +
  theme_bw() +
  scale_fill_manual(values = c("black", "white")) +
  scale_x_continuous(breaks = seq(0, 365, 10)) +
  geom_raster(alpha = 0.3, show_guide = FALSE)

enter image description here


1
看起来是时候买一个更宽的屏幕了... :) - David Arenburg

2
也许不是最佳方案,但我认为这对你有用:
df <- data.frame(day = 1:365, value = 1)
#do some data manipulation. Calculate as date
df$date <- as.Date(df$day, origin="2014-12-31")
str(df)

df$month <- month(df$date)
df$month_name <- month(df$date,label=T)
#calculate color 
df$month_color <- ifelse(df$month %% 2,"black","white")

#make plot using geom_bar and scale_fill/colour_identity()
plot2 <- ggplot(df, aes(x=day, y=value)) + 
  geom_bar(stat="identity",aes(fill=month_color,color=month_color))+
  scale_fill_identity() +
  scale_color_identity() +
  scale_x_continuous(breaks = seq(0, 365, 10)) +
  theme_bw() +
  theme(panel.grid=element_blank())

#make data for plotting months as geom_txt
month_df <- do.call(rbind,lapply(split(df,df$month_name),function(x){
  return(x[1,])
}))
month_df

plot2 + geom_text(data=month_df, aes(x=day+15, y=value-0.05, label=month_name),color="red")

Result


网页内容由stack overflow 提供, 点击上面的
可以查看英文原文,
原文链接