我有一个矩阵,即一个非嵌套列表,给定一个坐标列表,例如 {{0,0},{1,1},{2,2},...{5,5}} 的形式,我想在该矩阵中跟踪路径并以图形方式显示结果。路径的彩色带就足够了。
请帮我在 Mathematica 中编写这样的函数。非常感谢!
我有一个矩阵,即一个非嵌套列表,给定一个坐标列表,例如 {{0,0},{1,1},{2,2},...{5,5}} 的形式,我想在该矩阵中跟踪路径并以图形方式显示结果。路径的彩色带就足够了。
请帮我在 Mathematica 中编写这样的函数。非常感谢!
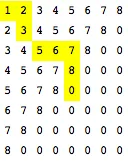
这里有一种可能性。
pos = {{1, 1}, {1, 2}, {2, 2}, {3, 3},
  {3, 4}, {3, 5}, {4, 5}, {5, 5}};
mat = HankelMatrix[8];
display = Map[Pane[#,{16,20},Alignment->Center]&, mat, {2}];
display = MapAt[Style[#, Background -> Yellow]&, display, pos];
Grid[display, Spacings->{0,0}]
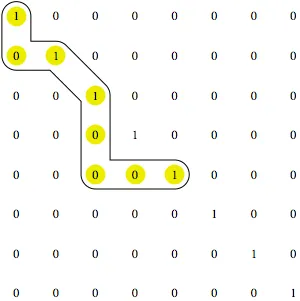
按照您所描述的那样,使用管道对条目进行轮廓绘制会更具难度。不过,如果我们愿意降低要求并使用图形基元,则仍然可以完成该操作。
mat = IdentityMatrix[8];
pos = {{1, 1}, {1, 2}, {2, 2}, {3, 3},
  {3, 4}, {3, 5}, {4, 5}, {5, 5}};
pos = Map[{#[[1]], -#[[2]]} &, pos];
outline = {CapForm["Round"], JoinForm["Round"],
  {AbsoluteThickness[30], Line[pos]},
  {AbsoluteThickness[28], White, Line[pos]}};
disks = Table[{Darker[Yellow, 0.07], Disk[p, 0.25]},
  {p, pos}];
numbers = MapIndexed[Style[Text[#, {#2[[1]], -#2[[2]]},
  {-0.2, 0.2}], FontSize -> 12] &, mat, {2}];
Graphics[{outline, disks, numbers}, ImageSize -> 300]
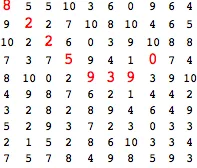
MapAt)... - aclpos = {{1, 1}, {1, 2}, {2, 2}, {2, 3}, {3, 3}, {3, 4}, {3, 5}, {4, 5}, {5, 5}, {5, 4}, {5, 3}}; Grid[MapAt[ Style[Pane[#, {16, 20}, Alignment -> Center], Background -> Yellow] &, IdentityMatrix[10], pos], Spacings -> {0, 0}],我得到的图形非常凌乱,间距混乱。如何解决? - user1096734EdgeForm),或者保留颜色,但用黑色粗线显示区域的轮廓。 - user1096734Style指令没有覆盖整个矩阵。我们可以通过在矩阵中的每个元素周围添加一个Pane来修复这个问题。另外,请参考我的“管道”示例。 - Mark McClure另一种可能性是使用ItemStyle:
m = RandomInteger[10, {10, 10}];
c = {{1, 1}, {2, 2}, {3, 3}, {4, 4}, {5, 5}, {5, 6}, {5, 7}, {4, 8}};
Grid[m, ItemStyle -> {Automatic, Automatic, Table[i -> {16, Red}, {i, c}]}]
最终看起来像这样:
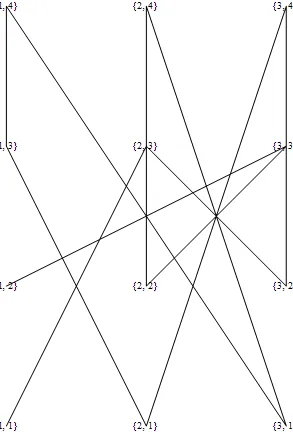
我可能误解了问题,但我认为这是你所要求的内容:
coords = Join @@ Array[List, {3, 4}]
{{1, 1}, {1, 2}, {1, 3}, {1, 4}, {2, 1}, {2, 2}, {2, 3}, {2, 4}, {3,
  1}, {3, 2}, {3, 3}, {3, 4}}

path = RandomSample[coords, Length[coords]]
{{1, 2}, {3, 3}, {2, 2}, {2, 4}, {3, 1}, {1, 4}, {1, 3}, {2, 1}, {3,
  4}, {3, 2}, {2, 3}, {1, 1}}

labels = Text[StyleForm[#], #] & /@ coords;


Graphics[Line[path], Epilog -> labels]