我有MNIST数据集,正在尝试使用pyplot可视化它。该数据集以格式存储,其中每行是一个784像素的图像。我想要在28*28的图像格式中使用pyplot或opencv进行可视化。我正在尝试直接使用:
plt.imshow(X[2:],cmap =plt.cm.gray_r, interpolation = "nearest")
但是它不起作用?你有什么想法可以帮助我解决这个问题。
我有MNIST数据集,正在尝试使用pyplot可视化它。该数据集以格式存储,其中每行是一个784像素的图像。我想要在28*28的图像格式中使用pyplot或opencv进行可视化。我正在尝试直接使用:
plt.imshow(X[2:],cmap =plt.cm.gray_r, interpolation = "nearest")
但是它不起作用?你有什么想法可以帮助我解决这个问题。
label, pixel_1_1, pixel_1_2, ...
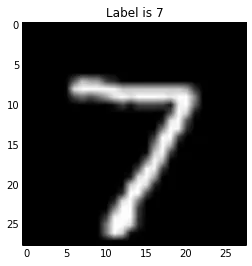
以下是如何使用Matplotlib和OpenCV在Python中对其进行可视化的方法
import numpy as np
import csv
import matplotlib.pyplot as plt

with open('mnist_test_10.csv', 'r') as csv_file:
    for data in csv.reader(csv_file):
        # The first column is the label
        label = data[0]

        # The rest of columns are pixels
        pixels = data[1:]

        # Make those columns into a array of 8-bits pixels
        # This array will be of 1D with length 784
        # The pixel intensity values are integers from 0 to 255
        pixels = np.array(pixels, dtype='uint8')

        # Reshape the array into 28 x 28 array (2-dimensional array)
        pixels = pixels.reshape((28, 28))

        # Plot
        plt.title('Label is {label}'.format(label=label))
        plt.imshow(pixels, cmap='gray')
        plt.show()

        break # This stops the loop, I just want to see one
您可以使用cv2.imshow()函数,以及上述的28x28形状和dtype='uint8'(无符号8位整数)的pixels numpy数组进行绘图。
    title = 'Label is {label}'.format(label=label)

    cv2.imshow(title, pixels)
    cv2.waitKey(0)
    cv2.destroyAllWindows()
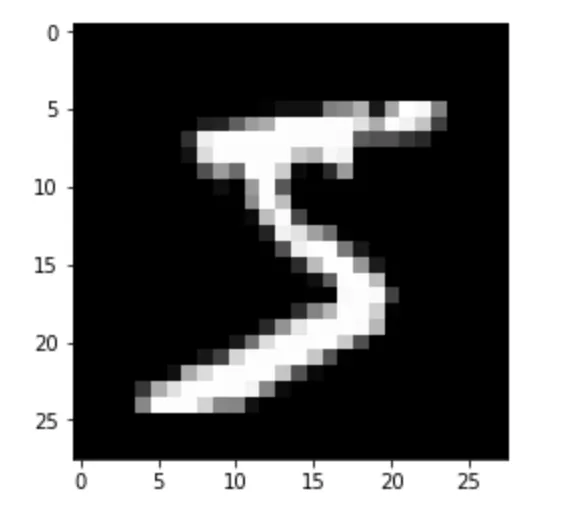
导入必要的包
import pandas as pd
import matplotlib.pyplot as plt
import numpy as np
将mnist训练数据集(格式为csv)读取为pandas dataframe
s = pd.read_csv("mnist_train.csv")
将pandas dataframe 转换成numpy矩阵
data = np.matrix(s)
output = data[:, 0]
从数据矩阵中删除第一列
data = np.delete(data, 0, 1)
img = data[0].reshape(28,28)

# And displaying the image
plt.imshow(img, cmap="gray")
如果您像我一样想要一个快速而简单的解决方案,只是为了大致了解给定输入内容的含义,可以在控制台中使用不带花哨库的方法:
def print_greyscale(pixels, width=28, height=28):
    def get_single_greyscale(pixel):
        val = 232 + round(pixel * 23)
        return '\x1b[48;5;{}m \x1b[0m'.format(int(val))

    for l in range(height):
        line_pixels = pixels[l * width:(l+1) * width]
        print(''.join(get_single_greyscale(p) for p in line_pixels))
[784] and with float values from 0 to 1. If either is not the case, you can easily convert (e.g. pixels = pixels.reshape((784,)) or pixels \= 255)
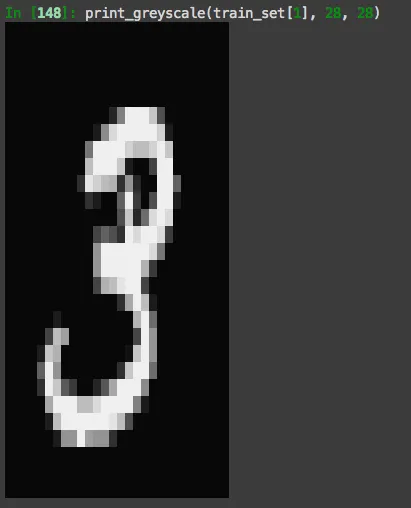
输出结果有点失真,但你可以了解到大概意思。