我的数据集来自Kaggle的MNIST。
我尝试使用
我尝试使用
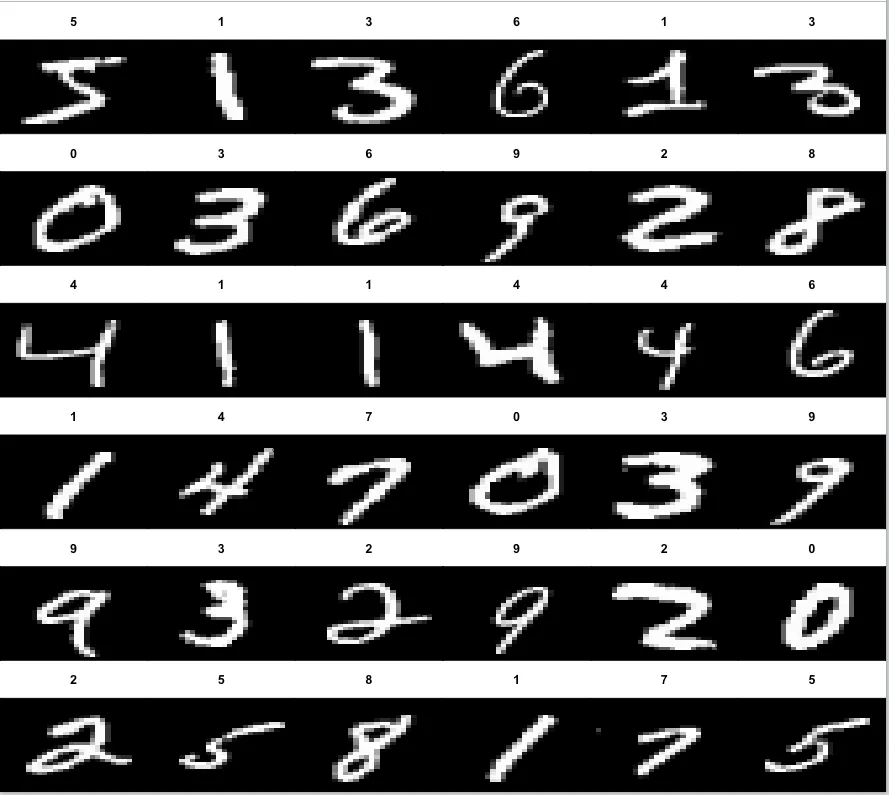
image函数来将训练集中的第一个数字可视化。不幸的是,出现了以下错误:>image(1:28, 1:28, im, col=gray((0:255)/255))
Error in image.default(1:28, 1:28, im, col = gray((0:255)/255)) :
'z' must be numeric or logical
添加几行代码:
rawfile<-read.csv("D://Kaggle//MNIST//train.csv",header=T) #Reading the csv file
im<-matrix((rawfile[1,2:ncol(rawfile)]), nrow=28, ncol=28) #For the 1st Image

image(1:28, 1:28, im, col=gray((0:255)/255))

Error in image.default(1:28, 1:28, im, col = gray((0:255)/255)) :
'z' must be numeric or logical
Error in x_train[idx, , , 1] : incorrect number of dimensions,请将该行替换为:im <- x_train[idx,,] - Juanan