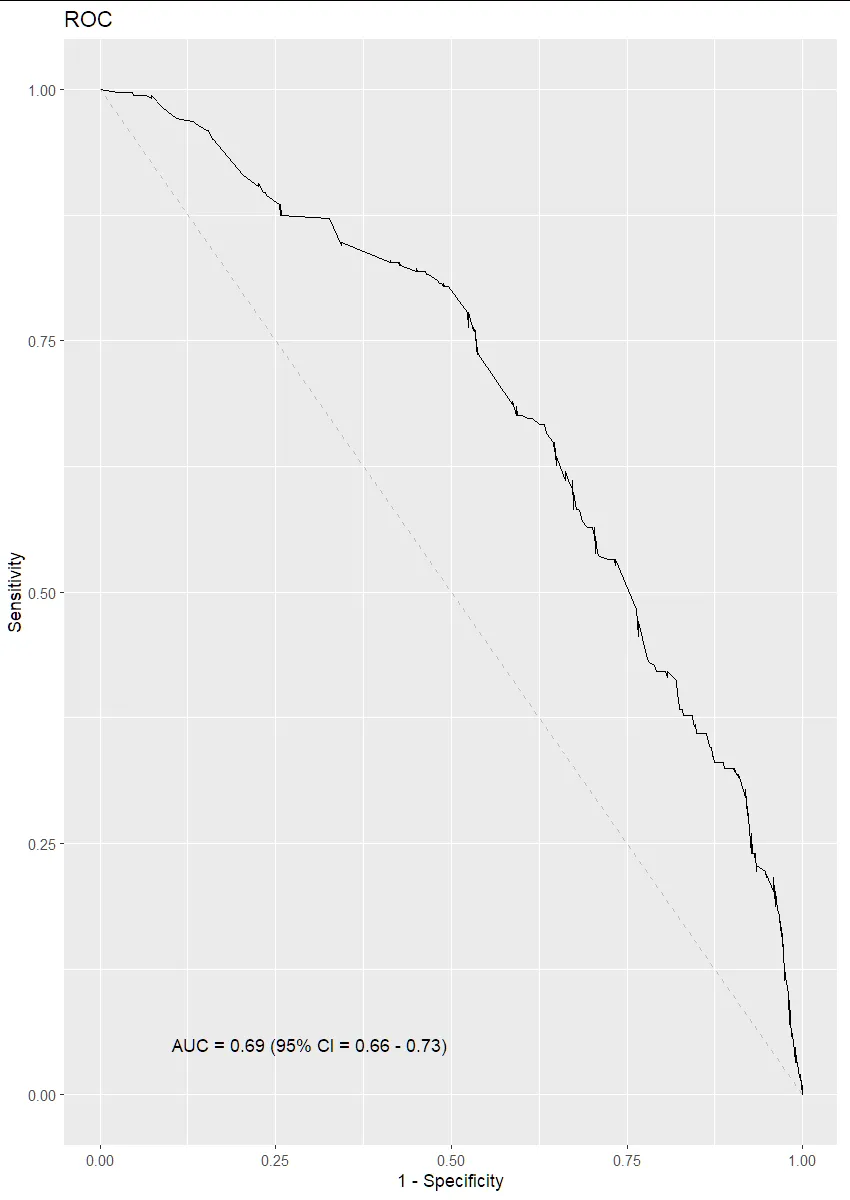
使用 ROC 曲线的 ggplot 中 scale_x_reverse 的问题

3

我尝试使用以下代码绘制我的ROC曲线:

library(titanic)
library(pROC)
library(ggplot2)
r <- roc(Survived ~ Fare, data = titanic_train)

#AUC text
auc <- auc(r)
ci <- ci.auc(r)
ci_l <- round(ci[1], 2)
ci_u <- round(ci[3], 2)

legend_text <- paste0("AUC = ", round(auc, 2), " (95% CI = ", ci_l, " - ", ci_u, ")")

#Plot
p <- ggroc(r) +
  scale_x_reverse() +
     labs(
          title="ROC",
          y = "Sensitivity",
          x = "1 - Specificity"
     ) +
     geom_segment(aes(x=1, xend=0, y=0, yend=1), color="grey", linetype="dashed") +
     annotate("text", x = 0.3, y = 0.05, label = legend_text)

print(p)

然而,“scale_x_reverse”存在问题,因为我收到了这个错误消息:“x轴的比例已经存在。添加另一个x轴的比例,将替换现有的比例。”

我希望X轴从0到1(因此将当前的1反转为0)。

有什么解决问题的想法吗?我不知道为什么它不起作用。

2个回答

2
一个可能的解决方案是在ggroc()中指定legacy.axes = TRUE,然后改变 geom_segment() 的设置,例如:
library(titanic)
library(pROC)
#> Type 'citation("pROC")' for a citation.
#> 
#> Attaching package: 'pROC'
#> The following objects are masked from 'package:stats':
#> 
#>     cov, smooth, var
library(ggplot2)

r <- roc(Survived ~ Fare, data = titanic_train)
#> Setting levels: control = 0, case = 1
#> Setting direction: controls < cases

auc <- auc(r)
ci <- ci.auc(r)
ci_l <- round(ci[1], 2)
ci_u <- round(ci[3], 2)

legend_text <- paste0("AUC = ", round(auc, 2), " (95% CI = ", ci_l, " - ", ci_u, ")")

p <- ggroc(r, legacy.axes = TRUE) +
  labs(
    title="ROC",
    y = "Sensitivity",
    x = "1 - Specificity"
  ) +
  geom_segment(aes(x=0, xend=1, y=0, yend=1), color="grey", linetype="dashed") +
  annotate("text", x = 0.3, y = 0.05, label = legend_text)

print(p)

使用reprex v2.0.2于2023年3月27日创建


不客气,很高兴你解决了问题 :) - jared_mamrot

1

我们可以使用scale_x_continuous()函数的limits参数将x轴限制在0到1之间,而不是使用scale_x_reverse()

library(titanic)
library(pROC)
library(ggplot2)

p <- ggroc(r) +
  scale_x_continuous(limits = c(0,1)) +
  labs(
    title="ROC",
    y = "Sensitivity",
    x = "1 - Specificity"
  ) +
  geom_segment(aes(x=1, xend=0, y=0, yend=1), color="grey", linetype="dashed") +
  annotate("text", x = 0.3, y = 0.05, label = legend_text)

print(p)

enter image description here


谢谢,但是我想要一张与这张相比更具反射性的图片。像这样:https://upload.wikimedia.org/wikipedia/commons/6/6b/Roccurves.png - user19745561

网页内容由stack overflow 提供, 点击上面的
可以查看英文原文,
原文链接