我只是提出一种可能关闭的想法。我需要画一个水晶球,其中红色和蓝色粒子随机分布。我想我得用Photoshop,甚至尝试在图像中制作球体,但由于这是研究论文,不必花哨,我想知道是否有任何用R、Matlab或其他语言编程的方法。
如何绘制一个带有两种颜色粒子的水晶球?
58
- Tae-Sung Shin
10
1我会使用VMD来完成这样的任务,但我也经常在日常工作中使用它,对于初学者来说可能有些困难... - aland
1有人应该使用这个水晶球来预测它应该是什么样子吗?你有没有想到一个特定的几何形状/物体?即使是在餐巾纸背面乱涂一笔,用手机相机拍下并上传到这里也会有所帮助。或者打开图像编辑器,大致手绘出来,保存并上传到这里。 - Gavin Simpson
3@bla:你能告诉我们在当前的答案集中有什么你找不到或做得不够好的东西吗? - Ben Bolker
3不,我不能这样做。我只是想用我的声望点数来看到更多我喜欢的内容(更多答案或答案选项)。如果没有什么激动人心的事情会发生,我会把悬赏给我最喜欢的答案。有什么不对吗? - bla
1不,只是想知道我们是否有特定的目标。 - Ben Bolker
显示剩余5条评论
9个回答
60
在R语言中,使用
rgl包(R到OpenGL接口):library(rgl)
n <- 100
set.seed(101)
randcoord <- function(n=100,r=1) {
d <- data.frame(rho=runif(n)*r,phi=runif(n)*2*pi,psi=runif(n)*2*pi)
with(d,data.frame(x=rho*sin(phi)*cos(psi),
y=rho*sin(phi)*sin(psi),
z=rho*cos(phi)))
}
## http://en.wikipedia.org/wiki/List_of_common_coordinate_transformations
with(randcoord(50,r=0.95),spheres3d(x,y,z,radius=0.02,col="red"))
with(randcoord(50,r=0.95),spheres3d(x,y,z,radius=0.02,col="blue"))
spheres3d(0,0,0,radius=1,col="white",alpha=0.5,shininess=128)
rgl.bg(col="black")
rgl.snapshot("crystalball.png")
- Ben Bolker
4
6那是一个非常漂亮的水晶球,但似乎底部有点漏了。 :-) - Andrie
是的,我认为设置粒子位置的最大半径会解决这个问题,但似乎并没有。我应该再多尝试一下。 - Ben Bolker
你使用的编程语言是什么? - Andrey Rubshtein
这是只有我这么觉得还是球内那些粒子似乎在移动/扭动?起初我以为这是一种动画,但它只是一个PNG……一定是某种视觉错觉。 - tobias_k
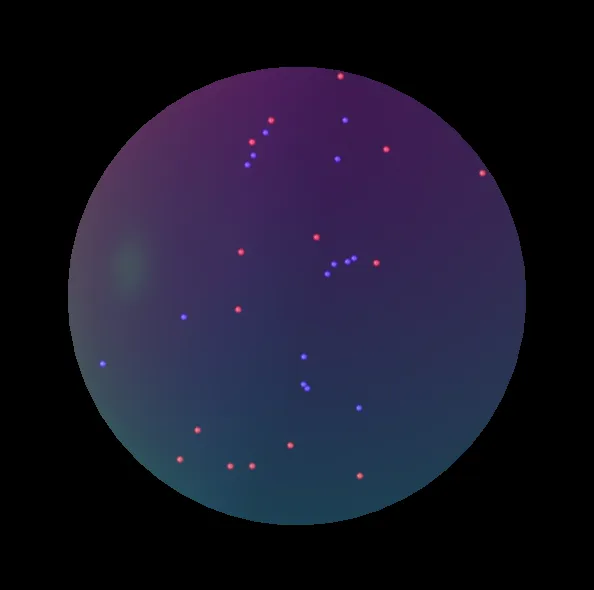
39
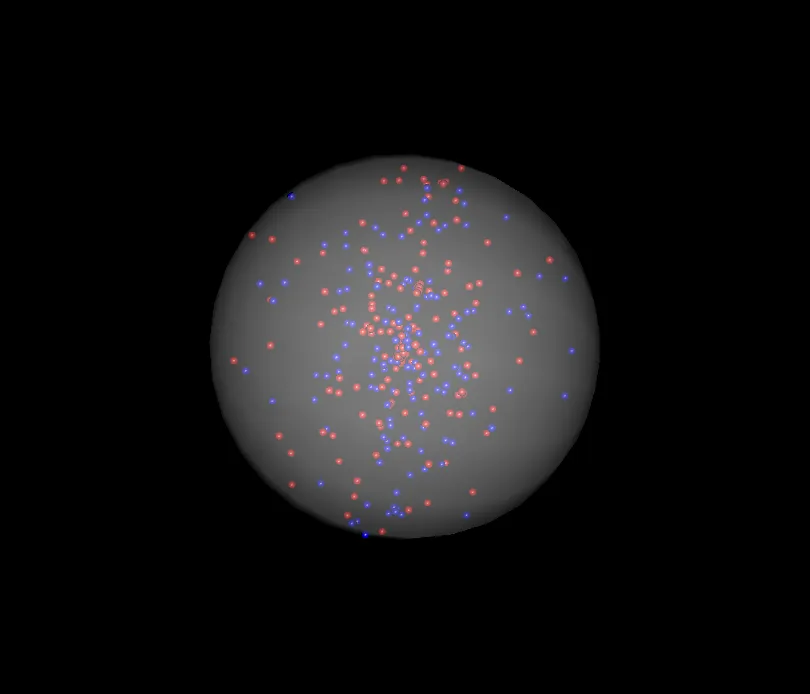
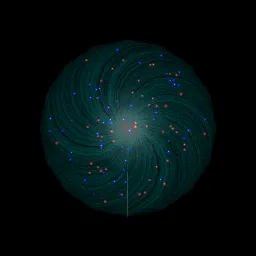
这与Ben Bolker的回答非常相似,但我将展示如何通过使用一些神秘的着色来为水晶球增添一点光环:
library(rgl)
lapply(seq(0.01, 1, by=0.01), function(x) rgl.spheres(0,0,0, rad=1.1*x, alpha=.01,
    col=colorRampPalette(c("orange","blue"))(100)[100*x]))
rgl.spheres(0,0,0, radius=1.11, col="red", alpha=.1)
rgl.spheres(0,0,0, radius=1.12, col="black", alpha=.1)
rgl.spheres(0,0,0, radius=1.13, col="white", alpha=.1)

xyz <- matrix(rnorm(3*100), ncol=3)
xyz <- xyz * runif(100)^(1/3) / sqrt(rowSums(xyz^2))

rgl.spheres(xyz[1:50,], rad=.02, col="blue")
rgl.spheres(xyz[51:100,], rad=.02, col="red")

rgl.bg(col="black")
rgl.viewpoint(zoom=.75)
rgl.snapshot("crystalball.png")
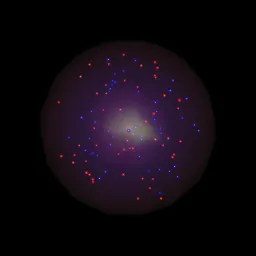
这两个图的唯一区别在于lapply调用中。通过改变colorRampPalette中的颜色,您可以显著改变水晶球的外观。左边的那个使用上面的lapply代码,右边的那个则使用以下代码:
lapply(seq(0.01, 1, by=0.01), function(x) rgl.spheres(0,0,0,rad=1.1*x, alpha=.01,
     col=colorRampPalette(c("orange","yellow"))(100)[100*x]))
...code from above
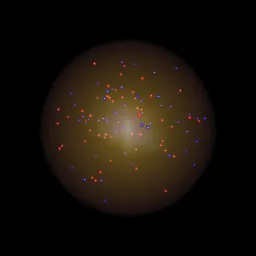
这里有一种不同的方法,您可以定义自己的纹理文件,并使用它来给水晶球上色:
# create a texture file, get as creative as you want:
png("texture.png")
x <- seq(1,870)
y <- seq(1,610)
z <- matrix(rnorm(870*610), nrow=870)
z <- t(apply(z,1,cumsum))/100

# Swirly texture options:
# Use the Simon O'Hanlon's roll function from this answer:
# https://dev59.com/9mMk5IYBdhLWcg3w-Spm#18791252
# roll <- function( x , n ){
#   if( n == 0 )
#     return( x )
#   c( tail(x,n) , head(x,-n) )
# }

# One option
# z <- mapply(function(x,y) roll(z[,x], y), x = 1:ncol(z), y=1:ncol(z))
#
# Another option
# z <- mapply(function(x,y) roll(z[,x], y), x = 1:ncol(z), y=rep(c(1:50,51:2), 10))[1:870, 1:610]
#
# One more
# z <- mapply(function(x,y) roll(z[,x], y), x = 1:ncol(z), y=rep(seq(0, 100, by=10), each=5))[1:870, 1:610]

par(mar=c(0,0,0,0))
image(x, y, z, col = colorRampPalette(c("cyan","black"))(100), axes = FALSE)
dev.off()

xyz <- matrix(rnorm(3*100), ncol=3)
xyz <- xyz * runif(100)^(1/3) / sqrt(rowSums(xyz^2))

rgl.spheres(xyz[1:50,], rad=.02, col="blue")
rgl.spheres(xyz[51:100,], rad=.02, col="red")

rgl.spheres(0,0,0, rad=1.1, texture="texture.png", alpha=0.4, back="cull")
rgl.viewpoint(phi=90, zoom=.75) # change the view if need be
rgl.bg(color="black")
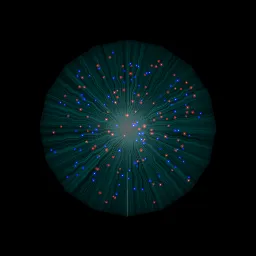
 !
!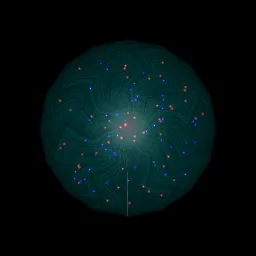
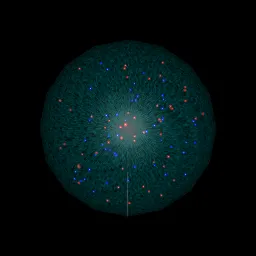
左上角的第一张图片是运行上面代码所得到的结果,其他三张图片则是使用代码中不同选项后的结果。
- Jota
2
1这些真的相当壮观! - Ben Bolker
1仅仅是一条小评论:你最好使用spheres3d()而不是rgl.spheres()。 rgl.*函数在处理颜色等默认值时,会以奇怪的方式进行处理。 - user2554330
33
既然问题是
我想知道是否有办法用R、matlab或任何其他语言编程。
而且TeX是图灵完备的,可以被视为一种编程语言,我花了一些时间,使用TikZ在LaTeX中创建了一个示例。正如原帖作者所写,这对于研究论文来说有一个优点,就是它可以直接集成到论文中,假设论文也是用LaTeX编写的。
那么,下面开始:
\documentclass[tikz]{standalone}
\usetikzlibrary{positioning, backgrounds}
\usepackage{pgf}
\pgfmathsetseed{\number\pdfrandomseed}

\begin{document}
\begin{tikzpicture}[background rectangle/.style={fill=black},
                    show background rectangle,
                   ]

    % Definitions
    \def\ballRadius{5}
    \def\pointRadius{0.1}
    \def\nRed{30}
    \def\nBlue{30}

    % Draw all red points
    \foreach \i in {1,...,\nRed}
    {
        % Get random coordinates
        \pgfmathparse{0.9*\ballRadius*rand}\let\mrho\pgfmathresult
        \pgfmathparse{360*rand}\let\mpsi\pgfmathresult
        \pgfmathparse{360*rand}\let\mphi\pgfmathresult

        % Convert to x/y/z
        \pgfmathparse{\mrho*sin(\mphi)*cos(\mpsi)}\let\mx\pgfmathresult
        \pgfmathparse{\mrho*sin(\mphi)*sin(\mpsi)}\let\my\pgfmathresult
        \pgfmathparse{\mrho*cos(\mphi)}\let\mz\pgfmathresult

        \fill[ball color=blue] (\mz,\mx,\my) circle (\pointRadius);
    }

    % Draw all blue points
    \foreach \i in {1,...,\nBlue}
    {
        % Get random coordinates
        \pgfmathparse{0.9*\ballRadius*rand}\let\mrho\pgfmathresult
        \pgfmathparse{360*rand}\let\mpsi\pgfmathresult
        \pgfmathparse{360*rand}\let\mphi\pgfmathresult

        % Convert to x/y/z
        \pgfmathparse{\mrho*sin(\mphi)*cos(\mpsi)}\let\mx\pgfmathresult
        \pgfmathparse{\mrho*sin(\mphi)*sin(\mpsi)}\let\my\pgfmathresult
        \pgfmathparse{\mrho*cos(\mphi)}\let\mz\pgfmathresult

        \fill[ball color=red] (\mz,\mx,\my) circle (\pointRadius);
    }

    % Draw ball
    \shade[ball color=blue!10!white,opacity=0.65] (0,0) circle (\ballRadius);

\end{tikzpicture}
\end{document}
结果是:
- hbaderts
25
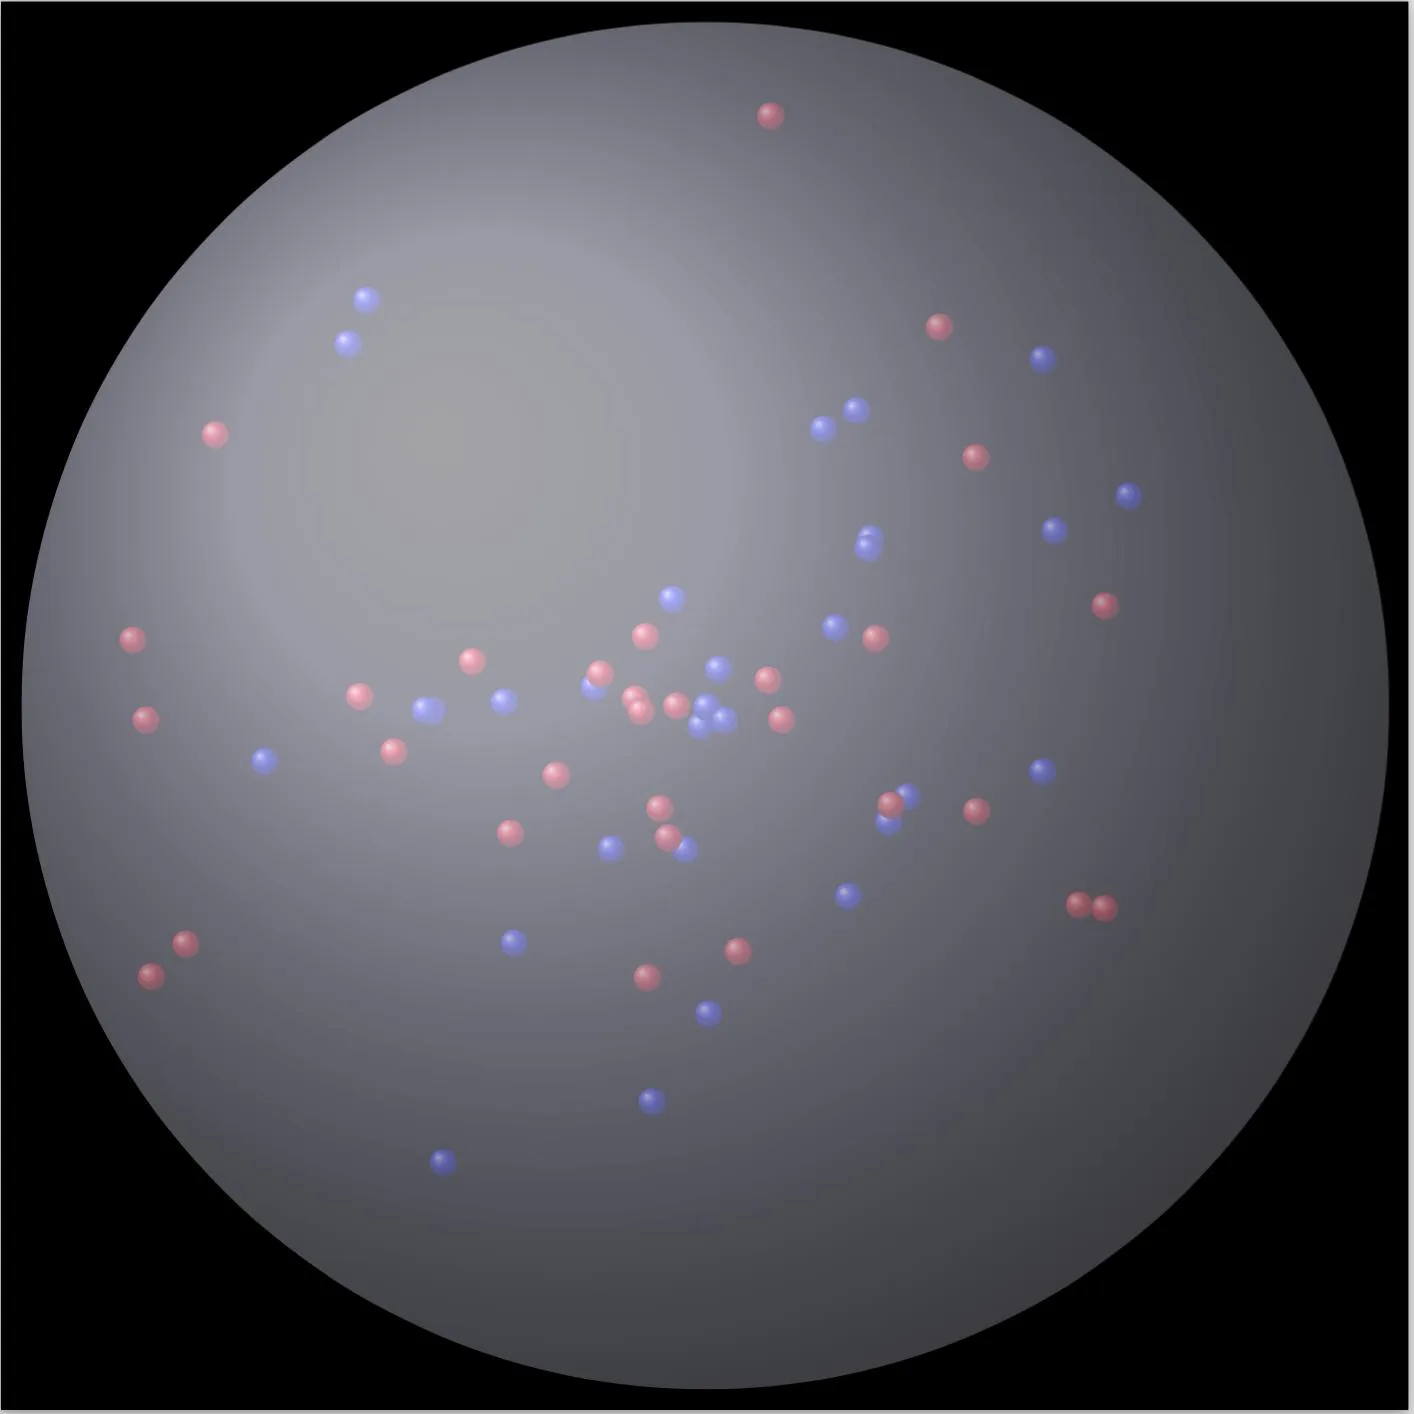
我只是不得不生成一些在Matlab中像R答案一样闪亮的东西 :) 所以,这是我的深夜过于复杂、超级慢的解决方案,但它很漂亮,不是吗? :)
figure(1), clf, hold on
whitebg('k')

light(...
    'Color','w',...
    'Position',[-3 -1 0],...
    'Style','infinite')

colormap cool
brighten(0.2)

[x,y,z] = sphere(50);
surf(x,y,z);

lighting phong
alpha(.2)
shading interp
grid off

blues = 2*rand(15,3)-1;
reds  = 2*rand(15,3)-1;
R     = linspace(0.001, 0.02, 20);

done = false;
while ~done

    indsB = sum(blues.^2,2)>1-0.02;
    if any(indsB)
        done = false;
        blues(indsB,:) = 2*rand(sum(indsB),3)-1;
    else
        done = true;
    end

    indsR = sum( reds.^2,2)>1-0.02;
    if any(indsR)
        done = false;
        reds(indsR,:) = 2*rand(sum(indsR),3)-1;
    else
        done = done && true;
    end

end

nR = numel(R);
[x,y,z] = sphere(15);
for ii = 1:size(blues,1)
    for jj = 1:nR
        surf(x*R(jj)-blues(ii,1), y*R(jj)-blues(ii,2), z*R(jj)-blues(ii,3), ...
            'edgecolor', 'none', ...
            'facecolor', [1-jj/nR 1-jj/nR 1],...
            'facealpha', exp(-(jj-1)/5));
    end
end

nR = numel(R);
[x,y,z] = sphere(15);
for ii = 1:size(reds,1)
    for jj = 1:nR
        surf(x*R(jj)-reds(ii,1), y*R(jj)-reds(ii,2), z*R(jj)-reds(ii,3), ...
            'edgecolor', 'none', ...
            'facecolor', [1 1-jj/nR 1-jj/nR],...
            'facealpha', exp(-(jj-1)/5));
    end
end

set(findobj(gca,'type','surface'),...
    'FaceLighting','phong',...
    'SpecularStrength',1,...
    'DiffuseStrength',0.6,...
    'AmbientStrength',0.9,...
    'SpecularExponent',200,...
    'SpecularColorReflectance',0.4 ,...
    'BackFaceLighting','lit');

axis equal
view(30,60)
- Rody Oldenhuis
2
不确定为什么您提到它非常慢,它只需要大约一秒钟的时间运行,对于想要制作1张图片的人来说似乎很好。 - Dennis Jaheruddin
没错。我知道如果更加注意这一点,它可以快上一个数量级。但是,实际上,谁在乎呢 :) - Rody Oldenhuis
18
我建议你看一下一个光线追踪程序, 例如 povray。虽然我不太懂这种语言,但是通过对一些示例进行尝试,我能够轻松地制作出这个。
background { color rgb <1,1,1,1> }
#include "colors.inc"
#include "glass.inc"

#declare R = 3;
#declare Rs = 0.05;
#declare Rd = R - Rs ;

camera {location <1, 10 ,1>
right <0, 4/3, 0>
 up    <0,0.1,1>
 look_at  <0.0 , 0.0 , 0.0>}

light_source {
    z*10000
    White
    }

light_source{<15,25,-25> color  rgb <1,1,1> }

#declare T_05 = texture { pigment { color Clear } finish { F_Glass1 } }


#declare Ball = sphere {
    <0,0,0>, R
      pigment { rgbf <0.75,0.8,1,0.9> } // A blue-tinted glass

    finish
  { phong 0.5 phong_size 40  // A highlight
    reflection 0.2  // Glass reflects a bit
  }
    interior{ior 1.5}
  }

#declare redsphere =    sphere {
    <0,0,0>, Rs
        pigment{color Red}
      texture { T_05 } interior { I_Glass4 fade_color Col_Red_01 }}

#declare bluesphere =   sphere {
    <0,0,0>, Rs
    pigment{color Blue}
      texture { T_05 } interior { I_Glass4 fade_color Col_Blue_01 }}

object{ Ball }

#declare Rnd_1 = seed (123);
 #for (Cntr, 0, 200)
#declare rr = Rd* rand( Rnd_1);
#declare theta = -pi/2 + pi * rand( Rnd_1);
#declare phi = -pi+2*pi* rand( Rnd_1);
#declare xx = rr * cos(theta) * cos(phi);
#declare yy = rr * cos(theta) * sin(phi);
#declare zz = rr * sin(theta) ;
object{ bluesphere  translate  <xx , yy , zz > }
#declare rr = Rd* rand( Rnd_1);
#declare theta = -pi/2 + pi * rand( Rnd_1);
#declare phi = -pi+2*pi* rand( Rnd_1);
#declare xx = rr * cos(theta) * cos(phi);
#declare yy = rr * cos(theta) * sin(phi);
#declare zz = rr * sin(theta) ;
object{ redsphere  translate  <xx , yy , zz > }
#end
- baptiste
2
非常好的水晶球,使用POVRay有很棒的光影效果。 - javier_domenech
1你能否在这里发布代码?它有点长,但似乎不太长。 - Ben Bolker
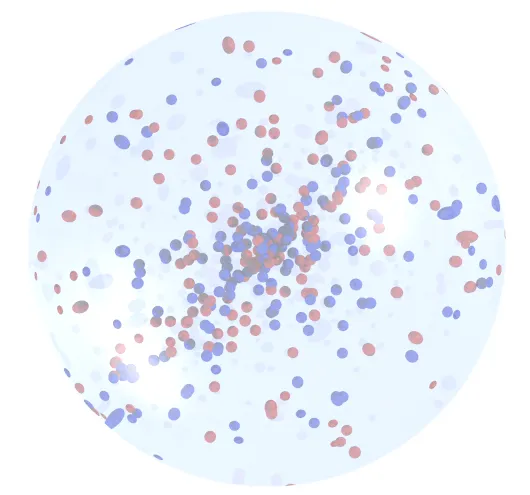
17
可能有些晚了,但这里提供一个Matlab代码,实现了scatter3sph(来自FEX)
figure('Color', [0.04 0.15 0.4]);
nos = 11; % number small of spheres
S= 3; %small spheres sizes
Grid_Size=256;
%Coordinates
X= Grid_Size*(0.5+rand(2*nos,1));
Y= Grid_Size*(0.5+rand(2*nos,1));
Z= Grid_Size*(0.5+rand(2*nos,1));
%Small spheres colors: (Red & Blue)
C= ones(nos,1)*[0 0 1];
C= [C;ones(nos,1)*[1 0 0]];
% Plot big Sphere
scatter3sph(Grid_Size,Grid_Size,Grid_Size,'size',220,'color',[0.9 0.9 0.9]); hold on
light('Position',[0 0 0],'Style','local');
alpha(0.45);
material shiny
% Plot small spheres
scatter3sph(X,Y,Z,'size',S,'color',C);
axis equal; axis tight; grid off
view([108 -42]);
set(gca,'Visible','off')
set(gca,'color','none')
- bla
1
很好。我觉得在R的例子中也应该能够获得光泽感,但我不想瞎搞来弄清楚它。 - Ben Bolker
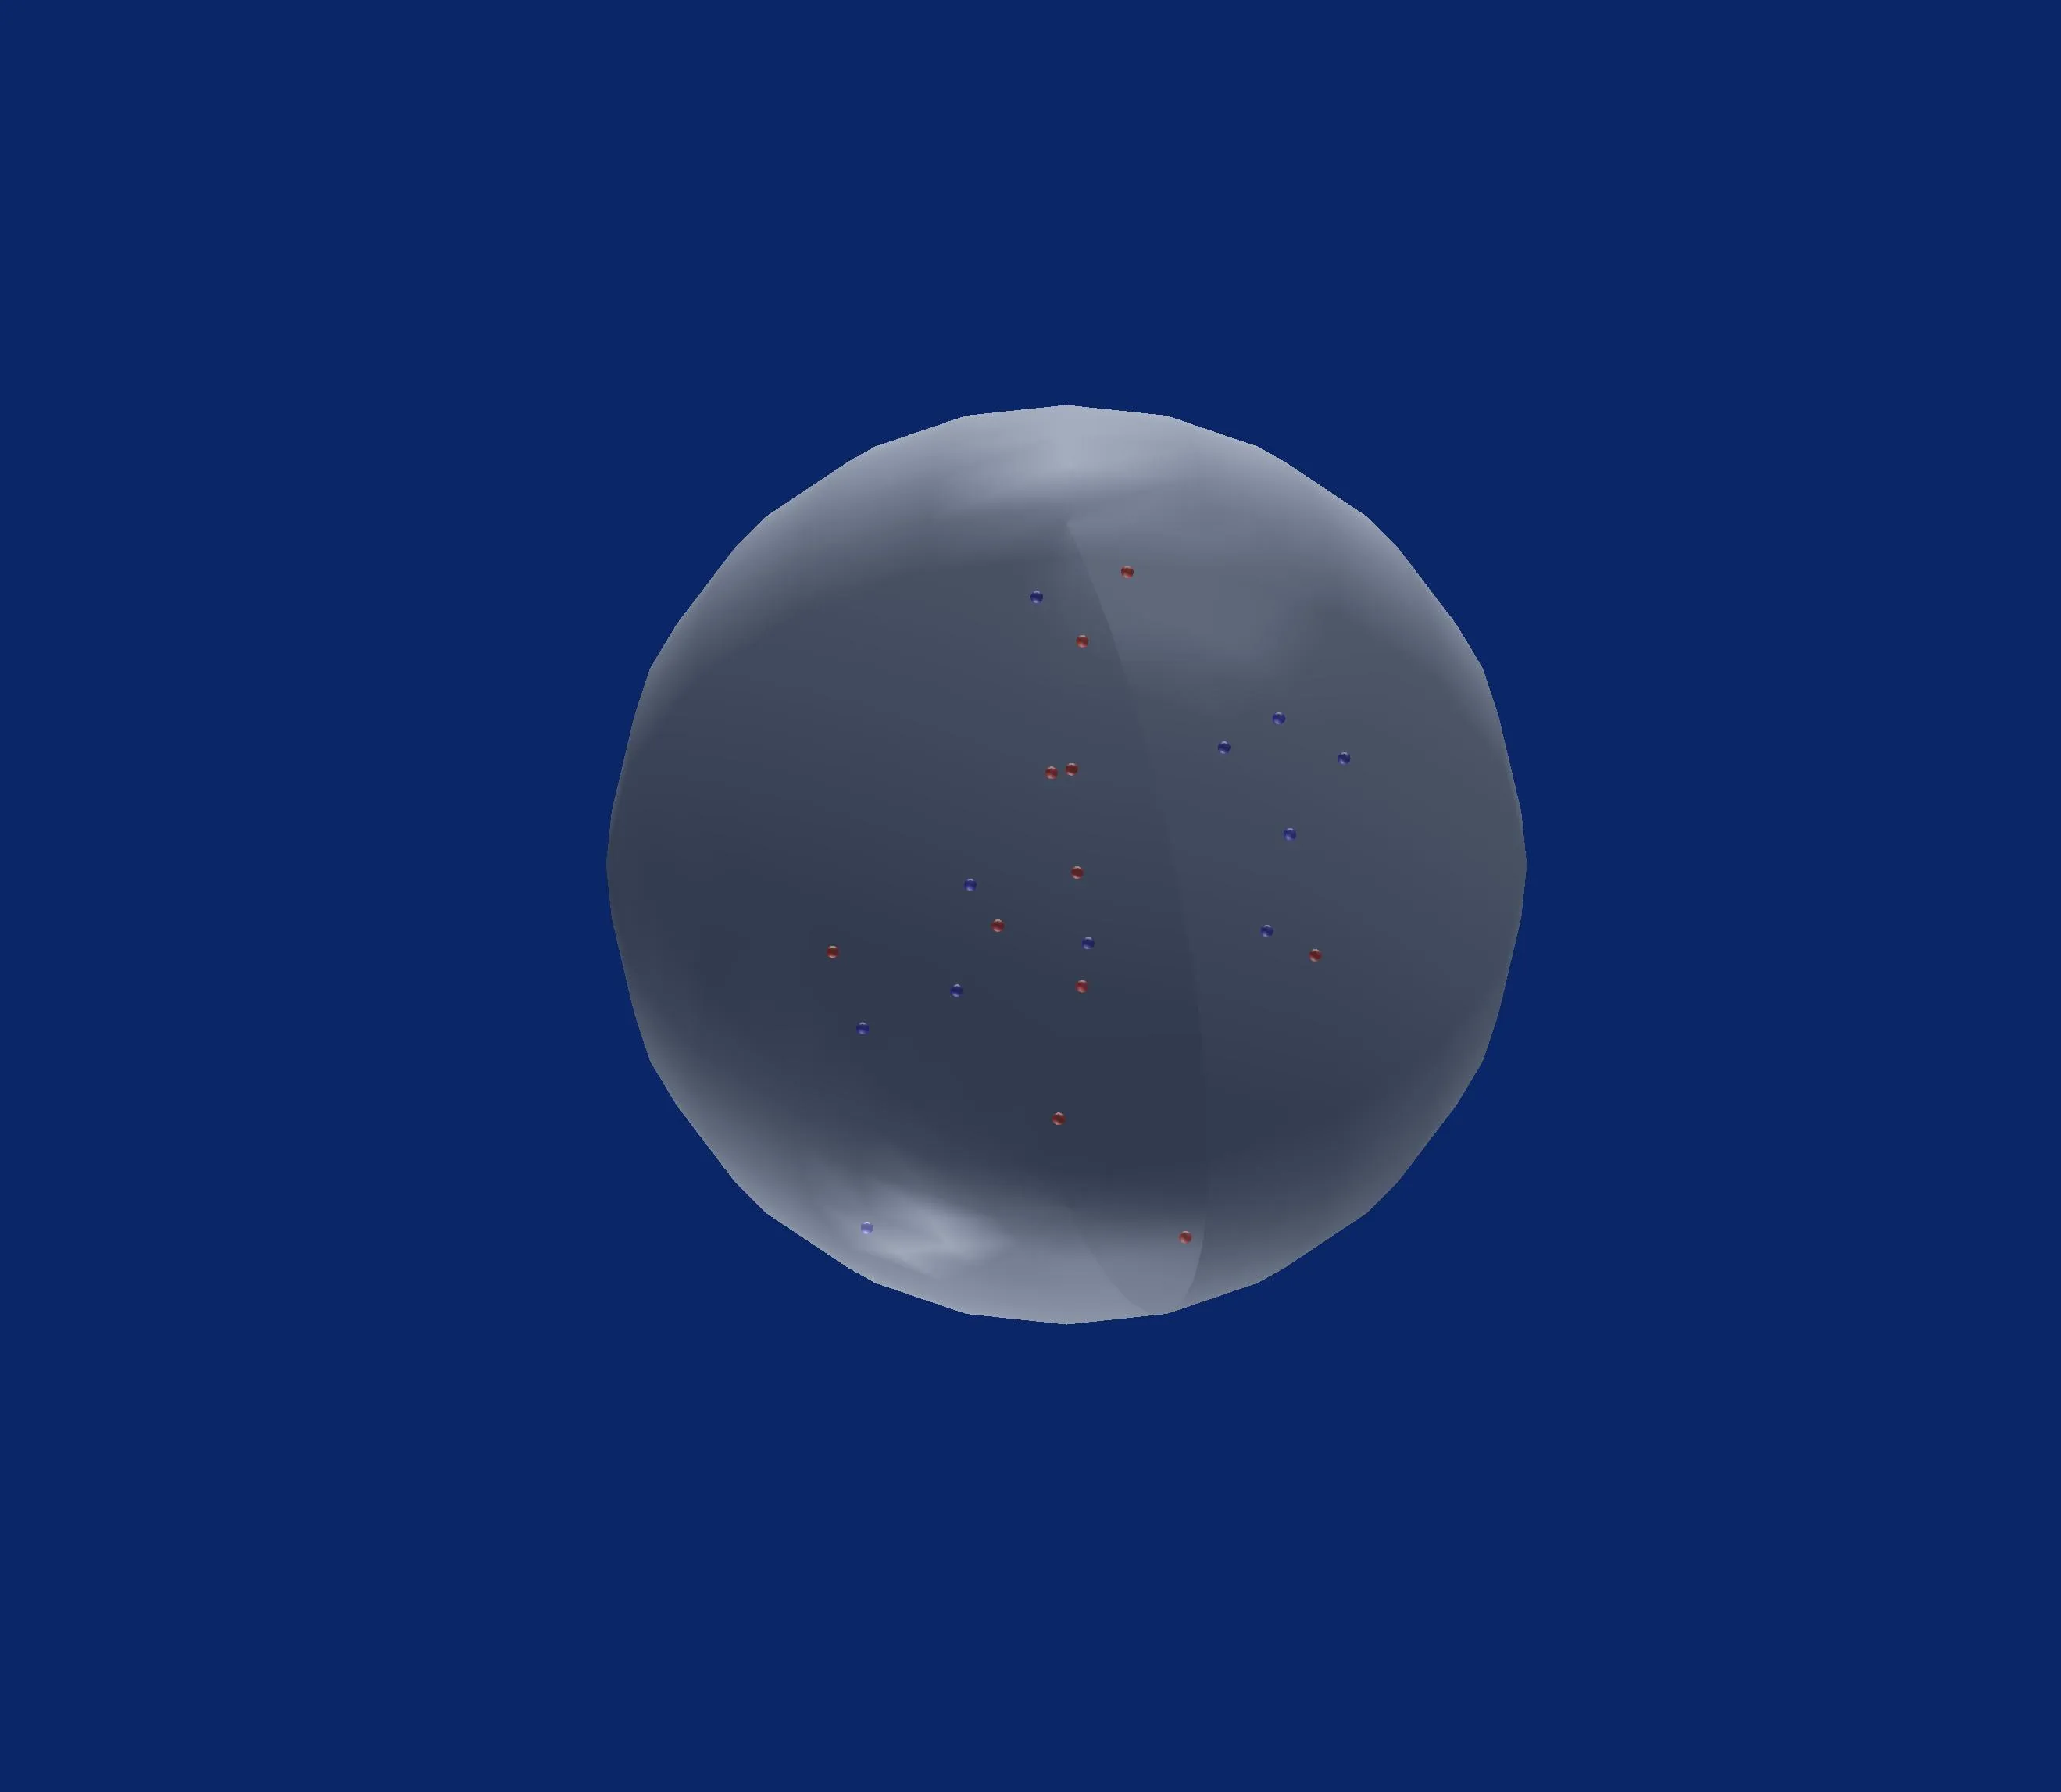
11
使用Matlab的另一种解决方案。
[x,y,z] = sphere(50);
[img] = imread('crystal.jpg');

figure('Color',[0 0 0]);
surf(x,y,z,img,'edgeColor','none','FaceAlpha',.6,'FaceColor','texturemap')
hold on;

i = 0;
while i<100
    px = randn();
    py = randn();
    pz = randn();
    d = pdist([0 0 0; px py pz],'euclidean');
    if d<1
        if mod(i,2)==0
            scatter3(px, py, pz,30,'ro','filled');
        else
            scatter3(px, py, pz,30,'bo','filled');
        end
        i = i+1;
    end
end

hold off;
camlight;

axis equal;
axis off;
输出:
- Huá dé ní 華得尼
11
在Javascript中使用d3.js:http://jsfiddle.net/jjcosare/rggn86aj/6/ 或者 >运行代码片段
适用于在线发布。
var particleChangePerMs = 1000;
var particleTotal = 250;
var particleSizeInRelationToCircle = 75;

var svgWidth = (window.innerWidth > window.innerHeight) ? window.innerHeight : window.innerWidth;
var svgHeight = (window.innerHeight > window.innerWidth) ? window.innerWidth : window.innerHeight;

var circleX = svgWidth / 2;
var circleY = svgHeight / 2;
var circleRadius = (circleX / 4) + (circleY / 4);
var circleDiameter = circleRadius * 2;

var particleX = function() {
  return Math.floor(Math.random() * circleDiameter) + circleX - circleRadius;
};
var particleY = function() {
  return Math.floor(Math.random() * circleDiameter) + circleY - circleRadius;
};
var particleRadius = function() {
  return circleDiameter / particleSizeInRelationToCircle;
};
var particleColorList = [
  'blue',
  'red'
];
var particleColor = function() {
  return "url(#" + particleColorList[Math.floor(Math.random() * particleColorList.length)] + "Gradient)";
};

var svg = d3.select("#quantumBall")
  .append("svg")
  .attr("width", svgWidth)
  .attr("height", svgHeight);

var blackGradient = svg.append("svg:defs")
  .append("svg:radialGradient")
  .attr("id", "blackGradient")
  .attr("cx", "50%")
  .attr("cy", "50%")
  .attr("radius", "90%")

blackGradient.append("svg:stop")
  .attr("offset", "80%")
  .attr("stop-color", "black")

blackGradient.append("svg:stop")
  .attr("offset", "100%")
  .attr("stop-color", "grey")

var redGradient = svg.append("svg:defs")
  .append("svg:linearGradient")
  .attr("id", "redGradient")
  .attr("x1", "0%")
  .attr("y1", "0%")
  .attr("x2", "100%")
  .attr("y2", "100%")
  .attr("spreadMethod", "pad");

redGradient.append("svg:stop")
  .attr("offset", "0%")
  .attr("stop-color", "red")
  .attr("stop-opacity", 1);

redGradient.append("svg:stop")
  .attr("offset", "100%")
  .attr("stop-color", "pink")
  .attr("stop-opacity", 1);

var blueGradient = svg.append("svg:defs")
  .append("svg:linearGradient")
  .attr("id", "blueGradient")
  .attr("x1", "0%")
  .attr("y1", "0%")
  .attr("x2", "100%")
  .attr("y2", "100%")
  .attr("spreadMethod", "pad");

blueGradient.append("svg:stop")
  .attr("offset", "0%")
  .attr("stop-color", "blue")
  .attr("stop-opacity", 1);

blueGradient.append("svg:stop")
  .attr("offset", "100%")
  .attr("stop-color", "skyblue")
  .attr("stop-opacity", 1);

svg.append("circle")
  .attr("r", circleRadius)
  .attr("cx", circleX)
  .attr("cy", circleY)
  .attr("fill", "url(#blackGradient)");

function isParticleInQuantumBall(particle) {
  var x1 = circleX;
  var y1 = circleY;
  var r1 = circleRadius;
  var x0 = particle.x;
  var y0 = particle.y;
  var r0 = particle.radius;
  return Math.sqrt((x1 - x0) * (x1 - x0) + (y1 - y0) * (y1 - y0)) < (r1 - r0);
};

function randomizedParticles() {
  d3.selectAll("svg > .particle").remove();
  var particle = {};
  particle.radius = particleRadius();
  for (var i = 0; i < particleTotal;) {
    particle.x = particleX();
    particle.y = particleY();
    particle.color = particleColor();
    if (isParticleInQuantumBall(particle)) {
      svg.append("circle")
        .attr("class", "particle")
        .attr("cx", particle.x)
        .attr("cy", particle.y)
        .attr("r", particle.radius)
        .attr("fill", particle.color);
      i++;
    }
  }
}

setInterval(randomizedParticles, particleChangePerMs);<script src="https://cdnjs.cloudflare.com/ajax/libs/d3/3.4.11/d3.min.js"></script>
<div id="quantumBall"></div>- jjcosare
10
在R中,您可以使用
更简单的方法(虽然可能不太好看)是使用
如果您想要在三维中进行此操作,请查看rgl软件包,这里是一个基本示例:
rasterImage函数将图像添加到当前绘图中。您可以创建/下载一个漂亮的水晶球图像并将其加载到R中(请参见png、EBImage或其他软件包),然后使其半透明,并使用rasterImage将其添加到当前绘图中。我建议先绘制2个有颜色的点,然后在上面放置球形图像(通过透明度,它们仍将可见且看起来像在里面)。更简单的方法(虽然可能不太好看)是使用
polygon函数绘制半透明灰色圆形来表示球。如果您想要在三维中进行此操作,请查看rgl软件包,这里是一个基本示例:
library(rgl)
open3d()
spheres3d(0,0,0, radius=1, color='lightgrey', alpha=0.2)
spheres3d(c(.3,-.3),c(-.2,.4),c(.1,.2), color=c('red','blue'),
     alpha=1, radius=0.15)
- Greg Snow
网页内容由stack overflow 提供, 点击上面的可以查看英文原文,
原文链接
原文链接