我正在尝试使用一个函数创建多个Plotly图表。我已为它们创建了一套调色板。我使用的数据集具有不同数量的分组因素,我希望它们按照我指定的顺序使用颜色,但似乎会根据因素的数量选择不同的顺序。是否有一种简单的方法来解决这个问题?我需要创建一个函数吗?谢谢!
问题的可视化示例:
library(plotly)
#Some example data
x <- 1:10
g <- c("A", "B", "C", "D", "E")
g2 <- c("A", "B")
g3 <- c("A", "B", "C")
y <- 1:20
df <- as.data.frame(cbind(x,g,y))
df2 <- as.data.frame(cbind(x,g2,y))
df3 <- as.data.frame(cbind(x,g3,y))
#Color palette
pal <- c('blue','yellow','green', 'pink', 'black')
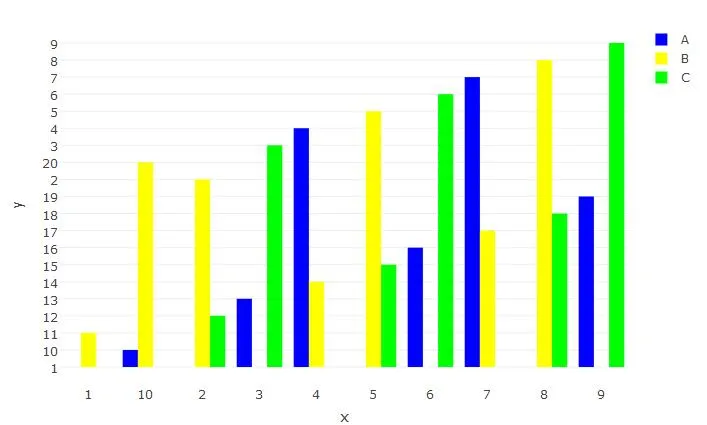
#In this plot the order is as in the pal object, this is what I want.
plot1 <- plot_ly(data=df, x=~x, y=~y,
type = "bar", color=~g, colors =pal)
plot1
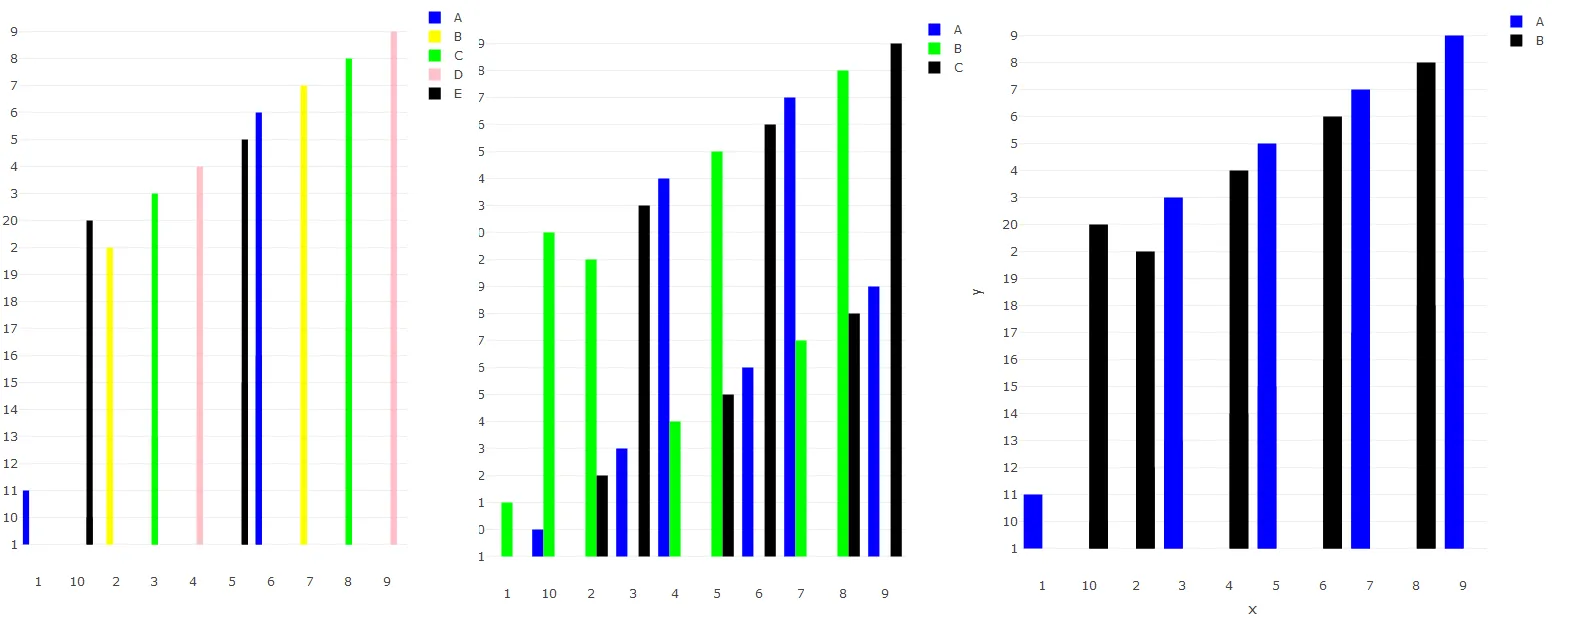
#In this plot uses the first and the fifth in the pal object
# and I would like to be the first and second colors.
plot2 <- plot_ly(data=df2, x=~x, y=~y,
type = "bar", color=~g2, colors =pal)
plot2
#In this one uses the first, the third and the fifth in that order
# and I would like to be the first, second and third colors.
plot3 <- plot_ly(data=df3, x=~x, y=~y,
type = "bar", color=~g3, colors =pal)
plot3