如何在Python 3中使用`networkx`的`pos`参数创建流程图样式的图表?

22
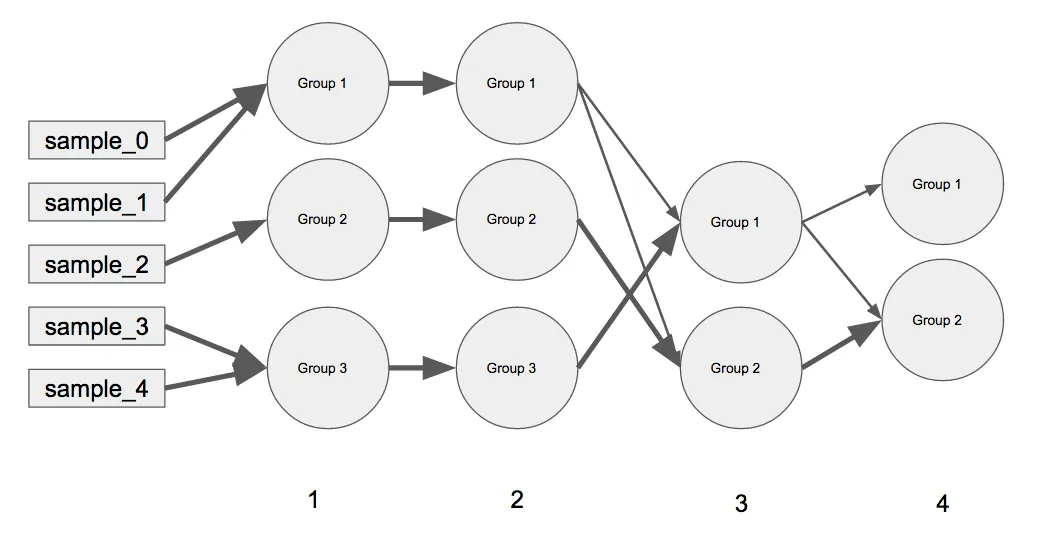
我正在尝试使用Python(最好是使用matplotlib和networkx,尽管我对bokeh也很感兴趣)创建类似于下面的线性网络图。

enter image description here

如何使用Python中的networkx高效地构建此图形绘制(pos)? 我想在更复杂的示例中使用它,因此我觉得为这个简单的示例硬编码位置将没有用处:(。是否有适用于此的networkx解决方案? pos(字典,可选)-一个以节点为键、位置为值的字典。如果未指定,则会计算弹簧布局定位。有关计算节点位置的函数,请参见networkx.layout。
我还没有看到任何关于如何在networkx中实现此目标的教程,这就是为什么我相信这个问题将成为社区可靠的资源。我已经广泛地阅读了networkx教程,但是没有类似的内容。 networkx的布局会使这种类型的网络难以解释,除非仔细使用pos参数...这是我唯一的选择。 https://networkx.github.io/documentation/networkx-1.9/reference/drawing.html文档中预先计算的布局似乎都无法很好地处理这种类型的网络结构。

简单例子:

(A)每个外部键表示从左到右移动的图表中的迭代(例如,迭代0表示样本,迭代1具有组1-3,迭代2相同,迭代3具有组1-2等)。 (B)内部字典包含该特定迭代中的当前分组以及表示当前组的先前组合的权重(例如,迭代3具有Group 1Group 2,对于迭代4,所有迭代3的Group 2都进入了迭代4的Group 2,但迭代3的Group 1已被拆分。权重总和始终为1。

我用于上面图形连接带权重的代码:

D_iter_current_previous =    {
        1: {
            "Group 1":{"sample_0":0.5, "sample_1":0.5, "sample_2":0, "sample_3":0, "sample_4":0},
            "Group 2":{"sample_0":0, "sample_1":0, "sample_2":1, "sample_3":0, "sample_4":0},
            "Group 3":{"sample_0":0, "sample_1":0, "sample_2":0, "sample_3":0.5, "sample_4":0.5}
            },
        2: {
            "Group 1":{"Group 1":1, "Group 2":0, "Group 3":0},
            "Group 2":{"Group 1":0, "Group 2":1, "Group 3":0},
            "Group 3":{"Group 1":0, "Group 2":0, "Group 3":1}
            },
        3: {
            "Group 1":{"Group 1":0.25, "Group 2":0, "Group 3":0.75},
            "Group 2":{"Group 1":0.25, "Group 2":0.75, "Group 3":0}
            },
        4: {
            "Group 1":{"Group 1":1, "Group 2":0},
            "Group 2":{"Group 1":0.25, "Group 2":0.75}
            }
        }

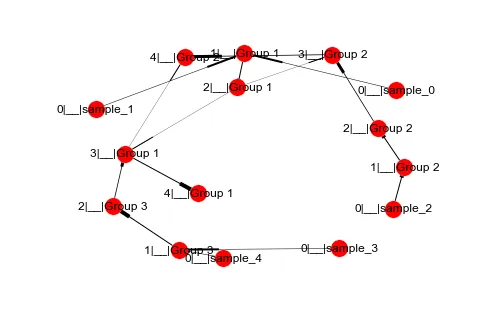
当我使用 networkx 制作图形时发生了以下情况:

import networkx
import matplotlib.pyplot as plt

# Create Directed Graph
G = nx.DiGraph()

# Iterate through all connections
for iter_n, D_current_previous in D_iter_current_previous.items():
    for current_group, D_previous_weights in D_current_previous.items():
        for previous_group, weight in D_previous_weights.items():
            if weight > 0:
                # Define connections using `|__|` as a delimiter for the names
                previous_node = "%d|__|%s"%(iter_n - 1, previous_group)
                current_node = "%d|__|%s"%(iter_n, current_group)
                connection = (previous_node, current_node)
                G.add_edge(*connection, weight=weight)

# Draw Graph with labels and width thickness
nx.draw(G, with_labels=True, width=[G[u][v]['weight'] for u,v in G.edges()])

enter image description here

注意:我能想到的另一种方法是在matplotlib中创建一个散点图,每个刻度代表一个迭代(包括初始样本),然后用不同的权重将点连接起来。这将是一些相当混乱的代码,尤其是尝试将标记的边缘与连接线对齐...但是,我不确定这和networkx是最好的方法,还是有一个专门用于这种绘图的工具(例如bokehplotly)。

你看过 networkx 教程了吗?在 matplotlib 中绘制 networkx 图形非常容易。你在哪个环节遇到了问题? - ImportanceOfBeingErnest
我知道如何使用networkx,但是布局会让它们变成随机的混乱。虽然可以使用pos参数,但自定义位置字典感觉很奇怪。我认为没有关于线性网络的教程。 - O.rka
我认为可以通过使用graphviz布局来实现这一点,但我不太确定它如何与更近期的networkx版本交互(API有些变化)。如果我有时间,我会尝试安装并运行。同时,可以尝试查看此答案 - 
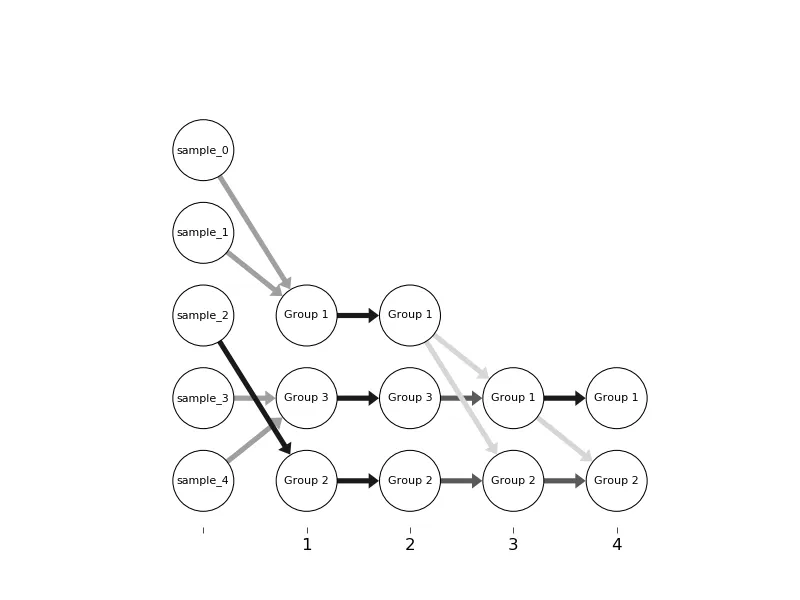
prog ='dot'至关重要,但可能会帮助你达到目标。请注意,除了networkxmatplotlib之外,还需要安装graphviz和pygraphviz - J Richard Snape
1个回答

18
Networkx具有良好的绘图功能,适用于探索性数据分析,但不适合制作出版质量的图形,原因有很多,这里不再赘述。因此,我从头开始重写了代码,并制作了一个独立的绘图模块netgraph,可以在这里找到(与原始版本一样基于matplotlib)。API非常相似且文档齐全,因此应该不难根据您的需求进行调整。
在此基础上,我得到了以下结果: enter image description here 我选择使用颜色表示边缘强度,因为您可以: 1)指示负值, 2)更好地区分小值。 但是,您也可以将边缘宽度传递给netgraph(请参见netgraph.draw_edges())。
分支的不同顺序是由您的数据结构(字典)引起的,它没有任何固有的顺序。您需要修改数据结构和下面的函数_parse_input()来解决这个问题。
代码:
import itertools
import numpy as np
import matplotlib.pyplot as plt
import netgraph; reload(netgraph)

def plot_layered_network(weight_matrices,
                         distance_between_layers=2,
                         distance_between_nodes=1,
                         layer_labels=None,
                         **kwargs):
    """
    Convenience function to plot layered network.

    Arguments:
    ----------
        weight_matrices: [w1, w2, ..., wn]
            list of weight matrices defining the connectivity between layers;
            each weight matrix is a 2-D ndarray with rows indexing source and columns indexing targets;
            the number of sources has to match the number of targets in the last layer

        distance_between_layers: int

        distance_between_nodes: int

        layer_labels: [str1, str2, ..., strn+1]
            labels of layers

        **kwargs: passed to netgraph.draw()

    Returns:
    --------
        ax: matplotlib axis instance

    """
    nodes_per_layer = _get_nodes_per_layer(weight_matrices)

    node_positions = _get_node_positions(nodes_per_layer,
                                         distance_between_layers,
                                         distance_between_nodes)

    w = _combine_weight_matrices(weight_matrices, nodes_per_layer)

    ax = netgraph.draw(w, node_positions, **kwargs)

    if not layer_labels is None:
        ax.set_xticks(distance_between_layers*np.arange(len(weight_matrices)+1))
        ax.set_xticklabels(layer_labels)
        ax.xaxis.set_ticks_position('bottom')

    return ax

def _get_nodes_per_layer(weight_matrices):
    nodes_per_layer = []
    for w in weight_matrices:
        sources, targets = w.shape
        nodes_per_layer.append(sources)
    nodes_per_layer.append(targets)
    return nodes_per_layer

def _get_node_positions(nodes_per_layer,
                        distance_between_layers,
                        distance_between_nodes):
    x = []
    y = []
    for ii, n in enumerate(nodes_per_layer):
        x.append(distance_between_nodes * np.arange(0., n))
        y.append(ii * distance_between_layers * np.ones((n)))
    x = np.concatenate(x)
    y = np.concatenate(y)
    return np.c_[y,x]

def _combine_weight_matrices(weight_matrices, nodes_per_layer):
    total_nodes = np.sum(nodes_per_layer)
    w = np.full((total_nodes, total_nodes), np.nan, np.float)

    a = 0
    b = nodes_per_layer[0]
    for ii, ww in enumerate(weight_matrices):
        w[a:a+ww.shape[0], b:b+ww.shape[1]] = ww
        a += nodes_per_layer[ii]
        b += nodes_per_layer[ii+1]

    return w

def test():
    w1 = np.random.rand(4,5) #< 0.50
    w2 = np.random.rand(5,6) #< 0.25
    w3 = np.random.rand(6,3) #< 0.75

    import string
    node_labels = dict(zip(range(18), list(string.ascii_lowercase)))

    fig, ax = plt.subplots(1,1)
    plot_layered_network([w1,w2,w3],
                         layer_labels=['start', 'step 1', 'step 2', 'finish'],
                         ax=ax,
                         node_size=20,
                         node_edge_width=2,
                         node_labels=node_labels,
                         edge_width=5,
    )
    plt.show()
    return

def test_example(input_dict):
    weight_matrices, node_labels = _parse_input(input_dict)
    fig, ax = plt.subplots(1,1)
    plot_layered_network(weight_matrices,
                         layer_labels=['', '1', '2', '3', '4'],
                         distance_between_layers=10,
                         distance_between_nodes=8,
                         ax=ax,
                         node_size=300,
                         node_edge_width=10,
                         node_labels=node_labels,
                         edge_width=50,
    )
    plt.show()
    return

def _parse_input(input_dict):
    weight_matrices = []
    node_labels = []

    # initialise sources
    sources = set()
    for v in input_dict[1].values():
        for s in v.keys():
            sources.add(s)
    sources = list(sources)

    for ii in range(len(input_dict)):
        inner_dict = input_dict[ii+1]
        targets = inner_dict.keys()

        w = np.full((len(sources), len(targets)), np.nan, np.float)
        for ii, s in enumerate(sources):
            for jj, t in enumerate(targets):
                try:
                    w[ii,jj] = inner_dict[t][s]
                except KeyError:
                    pass

        weight_matrices.append(w)
        node_labels.append(sources)
        sources = targets

    node_labels.append(targets)
    node_labels = list(itertools.chain.from_iterable(node_labels))
    node_labels = dict(enumerate(node_labels))

    return weight_matrices, node_labels

# --------------------------------------------------------------------------------
# script
# --------------------------------------------------------------------------------

if __name__ == "__main__":

    # test()

    input_dict =   {
        1: {
            "Group 1":{"sample_0":0.5, "sample_1":0.5, "sample_2":0, "sample_3":0, "sample_4":0},
            "Group 2":{"sample_0":0, "sample_1":0, "sample_2":1, "sample_3":0, "sample_4":0},
            "Group 3":{"sample_0":0, "sample_1":0, "sample_2":0, "sample_3":0.5, "sample_4":0.5}
            },
        2: {
            "Group 1":{"Group 1":1, "Group 2":0, "Group 3":0},
            "Group 2":{"Group 1":0, "Group 2":1, "Group 3":0},
            "Group 3":{"Group 1":0, "Group 2":0, "Group 3":1}
            },
        3: {
            "Group 1":{"Group 1":0.25, "Group 2":0, "Group 3":0.75},
            "Group 2":{"Group 1":0.25, "Group 2":0.75, "Group 3":0}
            },
        4: {
            "Group 1":{"Group 1":1, "Group 2":0},
            "Group 2":{"Group 1":0.25, "Group 2":0.75}
            }
        }

    test_example(input_dict)

    pass

1
@O.rka 我还没有费心为此设置它,而我必须在3周内提交我的博士论文,因此在那之前我不会这样做。只需下载 .py 文件(它只是一个文件),并将其暂时放置在您的工作目录中。它只依赖于 matplotlib,所以只要您安装了它,一切都应该正常工作。 - Paul Brodersen
当你得到答案时,请别忘了接受它,因为你曾经——我是说:努力地——为了那些虚拟的网络积分而奋斗。;-) - Paul Brodersen
顺便说一下,我看了你的源代码。kwargs.setdefault('edge_color', weights) 我不知道你可以这样做…… - O.rka
1
@moritzschaefer:我尝试维护我的代码和代码文档。我没有时间去维护所有的stackoverflow答案。netgraph现在是一个新的主要版本,API发生了(轻微的)不兼容性改变。如文档所述,node_positions现在是将节点ID映射到浮点数2元组(或等效物)的字典。如果您提供权重矩阵,则节点ID必须是与矩阵索引对应的整数(即从零开始)。如果您发布一个带有MWE的新问题,我很乐意提供帮助;如果您对此答案进行编辑,我也很乐意接受。 - Paul Brodersen
为什么在一个networkx问题中,用netgraph写的答案得到了最高的投票?这完全不相关。 - tribbloid
显示剩余5条评论

网页内容由stack overflow 提供, 点击上面的
可以查看英文原文,
原文链接