我如何在极坐标系下制作箭头图?我已经有了以r和theta为变量的数据。我已尝试过:
import numpy as np
radii = np.linspace(0.5,1,10)
thetas = np.linspace(0,2*np.pi,20)
theta, r = np.meshgrid(thetas, radii)
f = plt.figure()
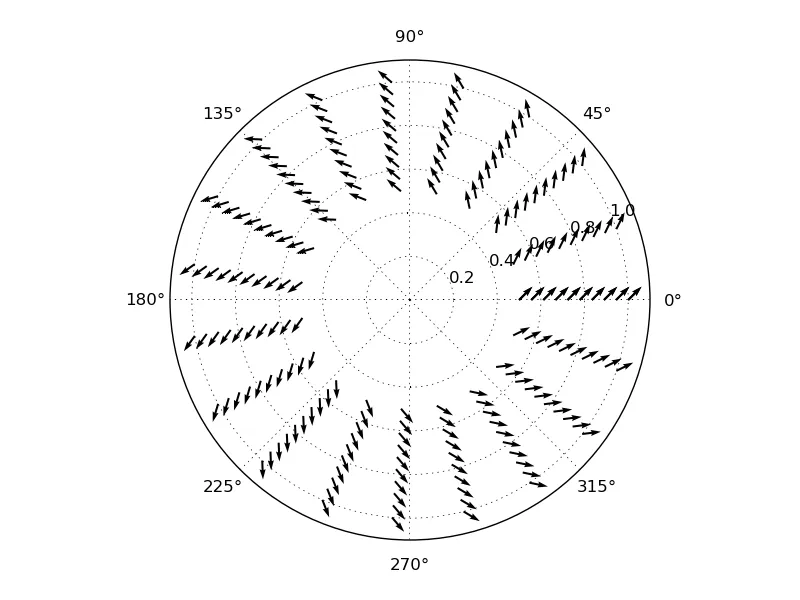
ax = f.add_subplot(111, polar=True)
ax.quiver(theta, r, dr, dt)
其中dr和dt是r和theta方向上的数据向量。