在Python中使用igraph进行社区检测,并将每个节点的社区编号写入CSV。

14

我有一个网络,想使用igraph中的edge_betweenness社区检测算法进行分析。我熟悉NetworkX,但尝试学习igraph,因为它比NetworkX具有更多的社区检测方法。

我的最终目标是运行edge_betweenness社区检测,并找到最优数量的社区,并编写一个CSV文件,其中包含图中每个节点的社区成员资格。

以下是我当前的代码。非常感谢任何能帮助我解决社区成员问题的人。

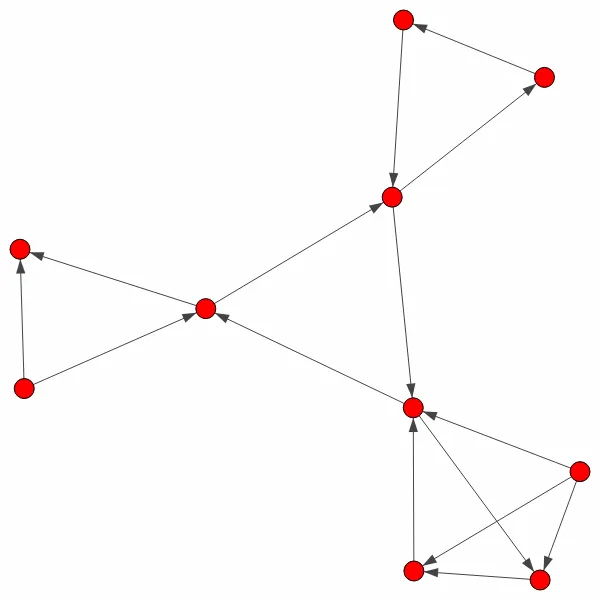
输入数据('network.txt'):

1 2
2 3
2 7
3 1
4 2
4 6
5 4
5 6
7 4
7 8
8 9
9 7
10 7
10 8
10 9

iGraph 代码

import igraph

# load data into a graph
g = igraph.Graph.Read_Ncol('network.txt')

# plot graph
igraph.plot(g)

igraph.plot(g)

# identify communities
communities = igraph.community_edge_betweenness()

# not really sure what to do next
num_communities = communities.optimal_count
communities.as_clustering(num_communities)

我应该怎么做才能找到最佳社区数,并将图中每个节点属于的社区写入列表?

1个回答

22
您已经在正确的轨道上了;最优社区数量(其中“最优”定义为“最大化模块度得分的社区数量)可以通过communities.optimal_count获取,而可以使用communities.as_clustering(num_communities)将社区结构转换为平级无交聚类。实际上,如果社区数量恰好等于communities.optimal_count,则可以省略社区数量。完成后,您会获得一个VertexClustering对象,该对象具有一个membership属性,可为图中每个顶点提供群集索引。
为了阐明,我将您的communities变量重命名为dendrogram,因为边介数社区检测算法实际上会产生一棵树状图:
# calculate dendrogram
dendrogram = graph.community_edge_betweenness()
# convert it into a flat clustering
clusters = dendrogram.as_clustering()
# get the membership vector
membership = clusters.membership

现在我们可以将成员向量以及节点名称写入CSV文件:
import csv
from itertools import izip

writer = csv.writer(open("output.csv", "wb"))
for name, membership in izip(graph.vs["name"], membership):
    writer.writerow([name, membership])

如果你使用的是Python 3,使用zip代替izip,不需要导入itertools


网页内容由stack overflow 提供, 点击上面的
可以查看英文原文,
原文链接