没有可行的例子,很难确定问题的确切原因。无论如何,我建议您解决问题的方法是复制您的轴(在同一图中),并仅使用第二个轴来控制附属物。
以下是一个可行的解决方案:
import numpy as np
import matplotlib.pyplot as plt
fig = plt.figure()
ax1 = fig.add_subplot(111)
ax2 = ax1.twiny()
fig.subplots_adjust(bottom=0.2)
ax1.set_xticks(range(-100, 100, 10))
ax1.set_xlim(-100, 100)
ax1.set_xticklabels([str(i) for i in range(-100, 100, 10)], rotation=45)
ax2.spines["bottom"].set_position(("axes", -0.1))
ax2.xaxis.set_ticks_position("bottom")
ax2.spines["bottom"].set_visible(True)
ax2.set_xticks([-50,50])
ax2.set_xticklabels(['Line 1', 'Line 2'], rotation=45, color='blue')
ax2.set_xlim(-100, 100)
b1 = np.random.randint(0,100,6)
b2 = np.random.randint(0,100,6)
b3 = np.random.randint(0,100,6)
ax1.scatter(np.random.normal(0, 1, 100)*100, np.random.normal(0, 1, 100)*100, c='green', s=90)
ax1.axvline(-50)
ax1.axvline(50)
plt.show()
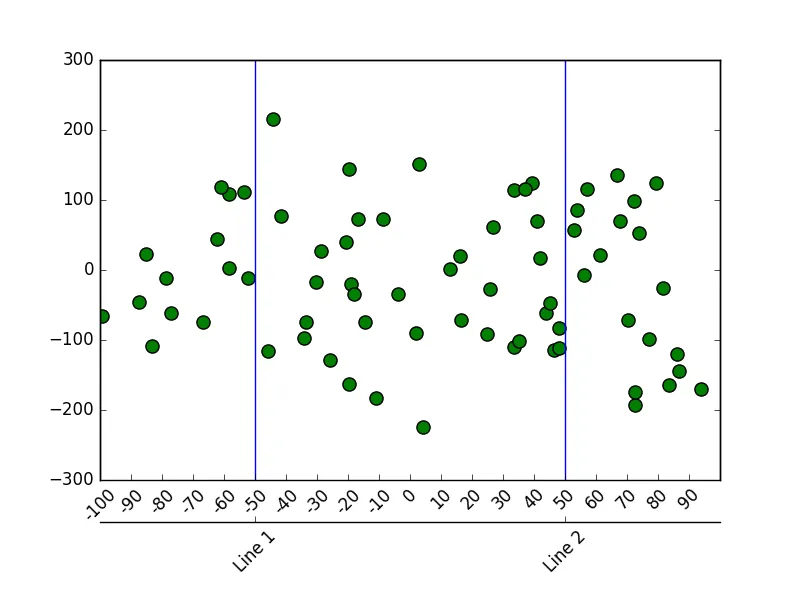
这会导致如下的结果: