我正在绘制标准正态分布。
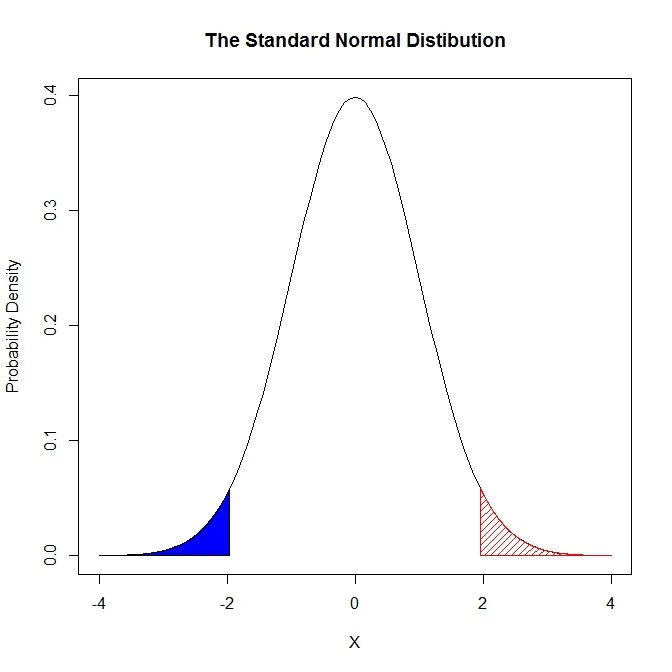
curve(dnorm(x), from=-4, to=4,
  main = "The Standard Normal Distibution",
  ylab = "Probability Density",
  xlab = "X")
出于教学目的,我想要阴影化我选择的某个分位数以下的区域。我该如何做?
如果你想使用 curve 和基础绘图,那么你可以使用 polygon 自己编写一个小函数:
colorArea <- function(from, to, density, ..., col="blue", dens=NULL){
    y_seq <- seq(from, to, length.out=500)
    d <- c(0, density(y_seq, ...), 0)
    polygon(c(from, y_seq, to), d, col=col, density=dens)
}
curve(dnorm(x), from=-4, to=4,
  main = "The Standard Normal Distibution",
  ylab = "Probability Density",
  xlab = "X")

colorArea(from=-4, to=qnorm(0.025), dnorm)
colorArea(from=qnorm(0.975), to=4, dnorm, mean=0, sd=1, col=2, dens=20)
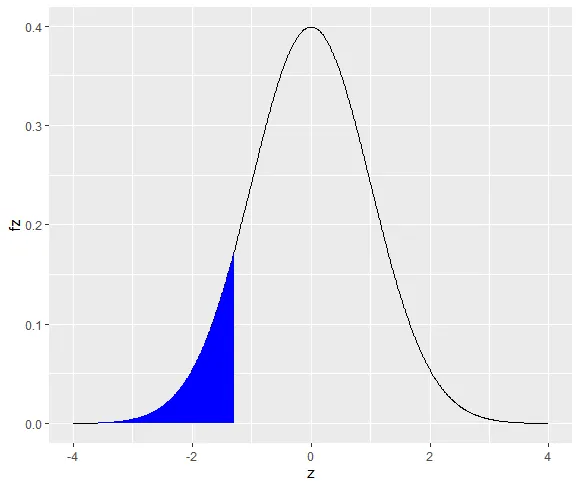
R代码来阴影标准正态曲线在某个(给定的)分位数以下的区域:library(ggplot2)
z <- seq(-4,4,0.01)
fz <- dnorm(z)
q <- qnorm(0.1) # the quantile
x <- seq(-4, q, 0.01)
y <- c(dnorm(x), 0, 0)
x <- c(x, q, -4)
ggplot() + geom_line(aes(z, fz)) +
geom_polygon(data = data.frame(x=x, y=y), aes(x, y), fill='blue')