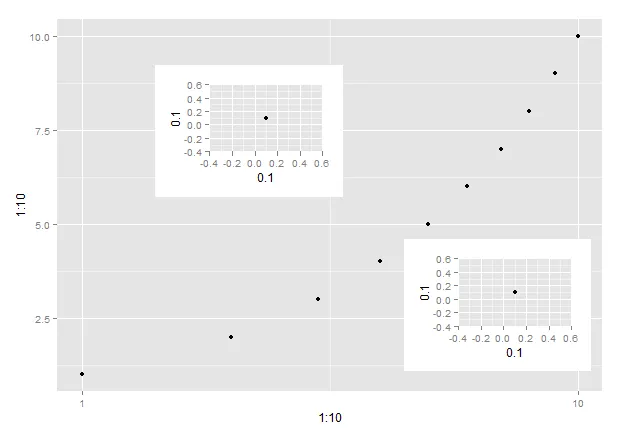
我有一个x轴采用对数刻度的图形。尝试创建插图时无法正常工作,但如果将比例改为线性,则似乎没问题。是否有解决方法,还是这是ggplot的限制?
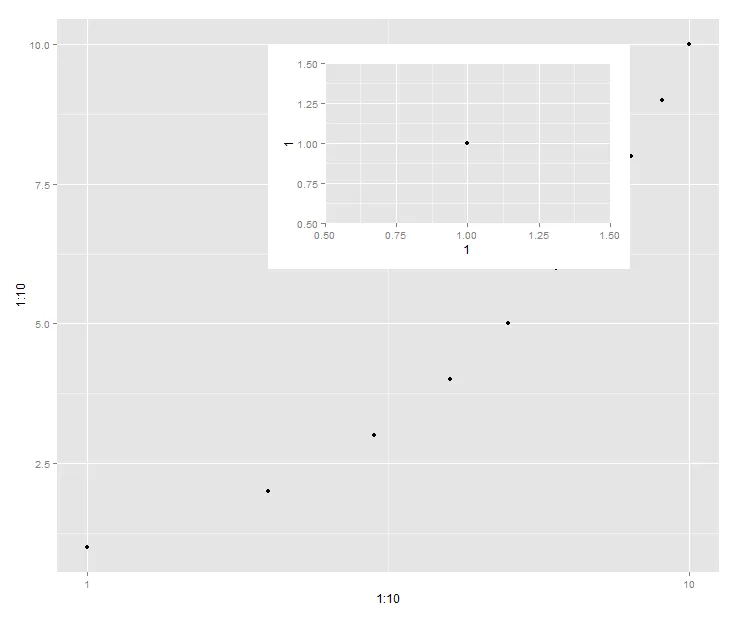
这个可以:
p = qplot(1:10, 1:10)
g = ggplotGrob(qplot(1, 1))
p + annotation_custom(grob = g, xmin = 3, xmax = 6, ymin = 6, ymax = 10)
这个不行:
p = qplot(1:10, 1:10, log='x')
g = ggplotGrob(qplot(1, 1))
p + annotation_custom(grob = g, xmin = 3, xmax = 6, ymin = 6, ymax = 10)