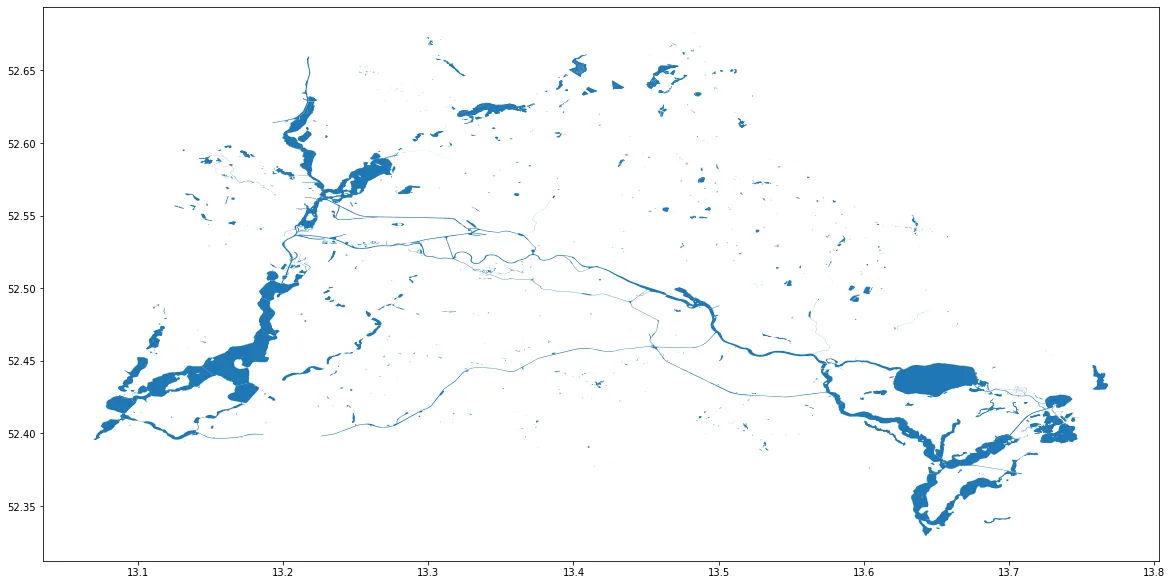
我使用来自OpenStreetMap的shape文件(link)创建了一个简单的geopandas地图。
import geopandas as gpd

map_gdf = gpd.read_file('path_to_shapefile')
map_gdf.plot()
输出:
我如何限制绘图仅在图像的某个部分,从而放大到特定位置。我能否通过指定我想要在纬度和经度上绘制的地图部分的范围来实现这一点?
geopandas.GeoDataFrame 的 .plot() 方法返回一个 Matplotlib Axes 对象。换句话说,您可以将返回的地图简单地分配给 Axes 对象,然后使用 set_xlim 和 set_ylim 控制边界值。
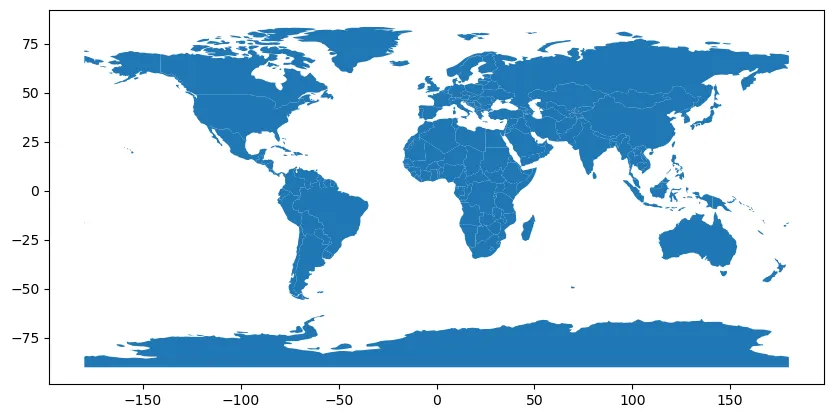
例如,让我们使用 geopandas 的示例数据集。
import geopandas as gpd
import matplotlib.pyplot as plt

# read sample dataset
data = gpd.datasets.get_path('naturalearth_lowres')
gdf = gpd.read_file(data)

# create an Axes object and plot the map
fig, ax = plt.subplots(figsize=(10, 10))
gdf.plot(ax=ax)
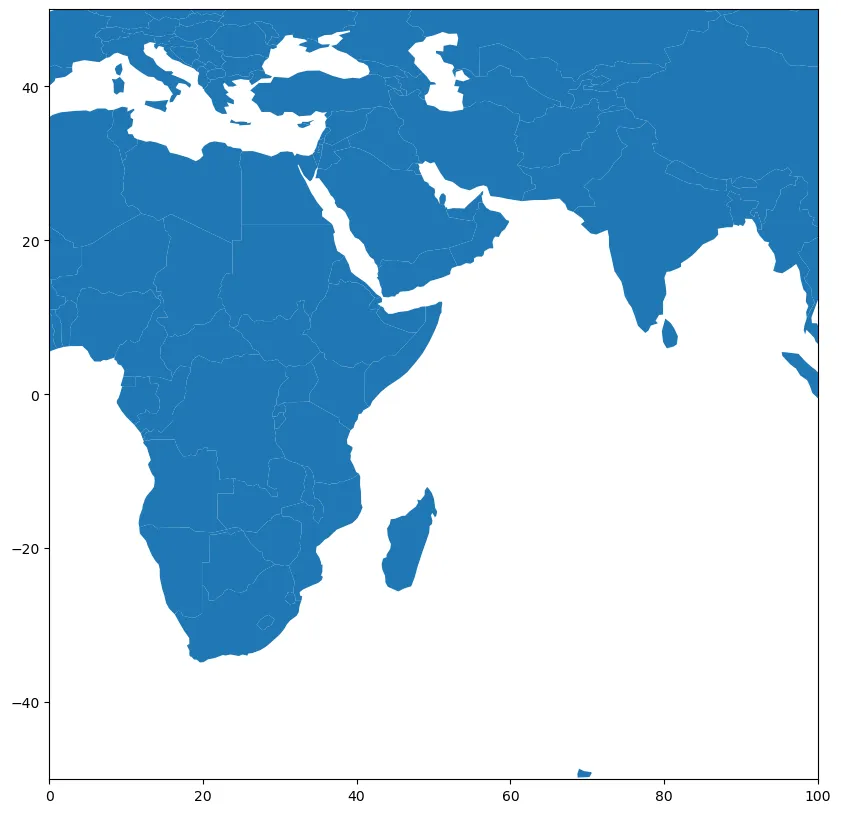
set_xlim和set_ylim来更改范围。# create an Axes object and plot the map
fig, ax = plt.subplots(figsize=(10, 10))
gdf.plot(ax=ax)
ax.set_xlim(0, 100)
ax.set_ylim(-50, 50)
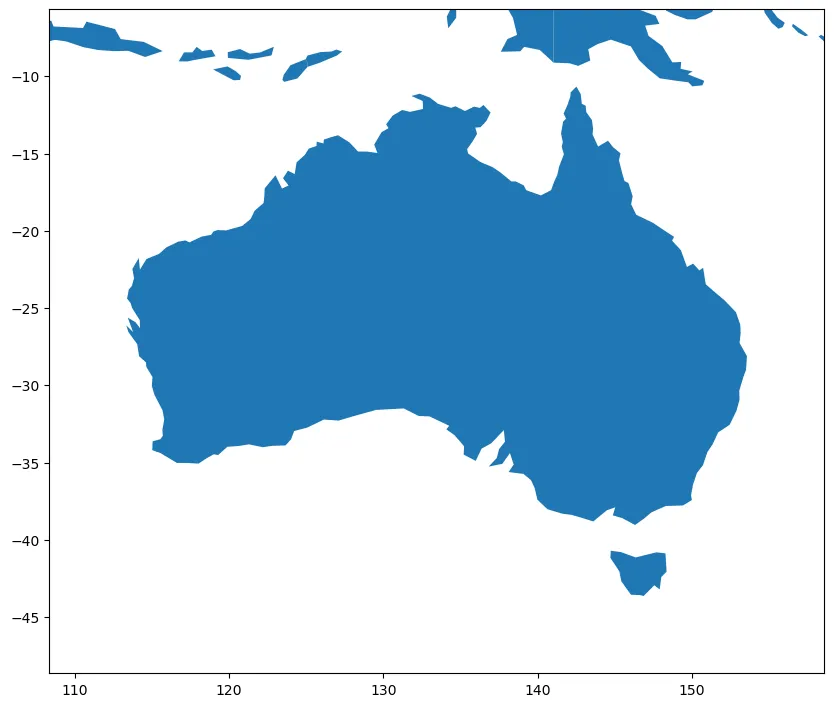
GeoDataFrame中的几何对象都有一个total_bounds属性。假设您想集中在澳大利亚地区。# create an Axes object and plot the map
fig, ax = plt.subplots(figsize=(10, 10))
gdf.plot(ax=ax)
xmin, ymin, xmax, ymax = gdf[gdf.name == 'Australia'].total_bounds
pad = 5 # add a padding around the geometry
ax.set_xlim(xmin-pad, xmax+pad)
ax.set_ylim(ymin-pad, ymax+pad)
这将使你得到