我已经创建了一个geopandas地图,显示了一个州及其所有的行政位置。
map_df
NAME    ADMIN_LEVE  geometry    Party
0   Valsad  5   POLYGON ((73.02324 20.72237, 73.04599 20.70275...   3
1   Mumbai  None    POLYGON ((72.76066 18.83622, 72.75976 19.18686...   2
2   Mumbai  5   POLYGON ((72.83468 19.04853, 72.84073 19.04861...   2
3   Daman   5   POLYGON ((72.85930 20.47104, 72.86580 20.46770...   2
4   Bharathiya Kamala Nagar None    POLYGON ((72.87127 19.02556, 72.87158 19.02717...   5
... ... ... ... ...
79  Dantewada   5   POLYGON ((80.82621 19.34821, 80.83647 19.33215...   4
80  Raj Nandgaon    5   POLYGON ((80.81506 20.76028, 80.81328 20.74423...   1
81  Kanker  5   POLYGON ((80.91854 20.09037, 80.89668 20.09483...   2
82  Bastar  5   POLYGON ((80.92032 19.31699, 80.89713 19.31387...   1
83  Durg    5   POLYGON ((80.84896 20.66974, 80.82175 20.68357...   4
这是我用来创建状态图的代码:
fig, ax = plt.subplots(1, figsize=(200, 100))
cmap = colors.ListedColormap(['red', 'blue', 'green', 'yellow', 'orange'])
bounds = [1,2,3,4,5,6]
norm = colors.BoundaryNorm(bounds, cmap.N)
ax.axis('off')
map_df.plot(column='Party', cmap=cmap, norm=norm,linewidth=0.8, ax=ax, edgecolor='0.8')
plt.show()
当前输出:
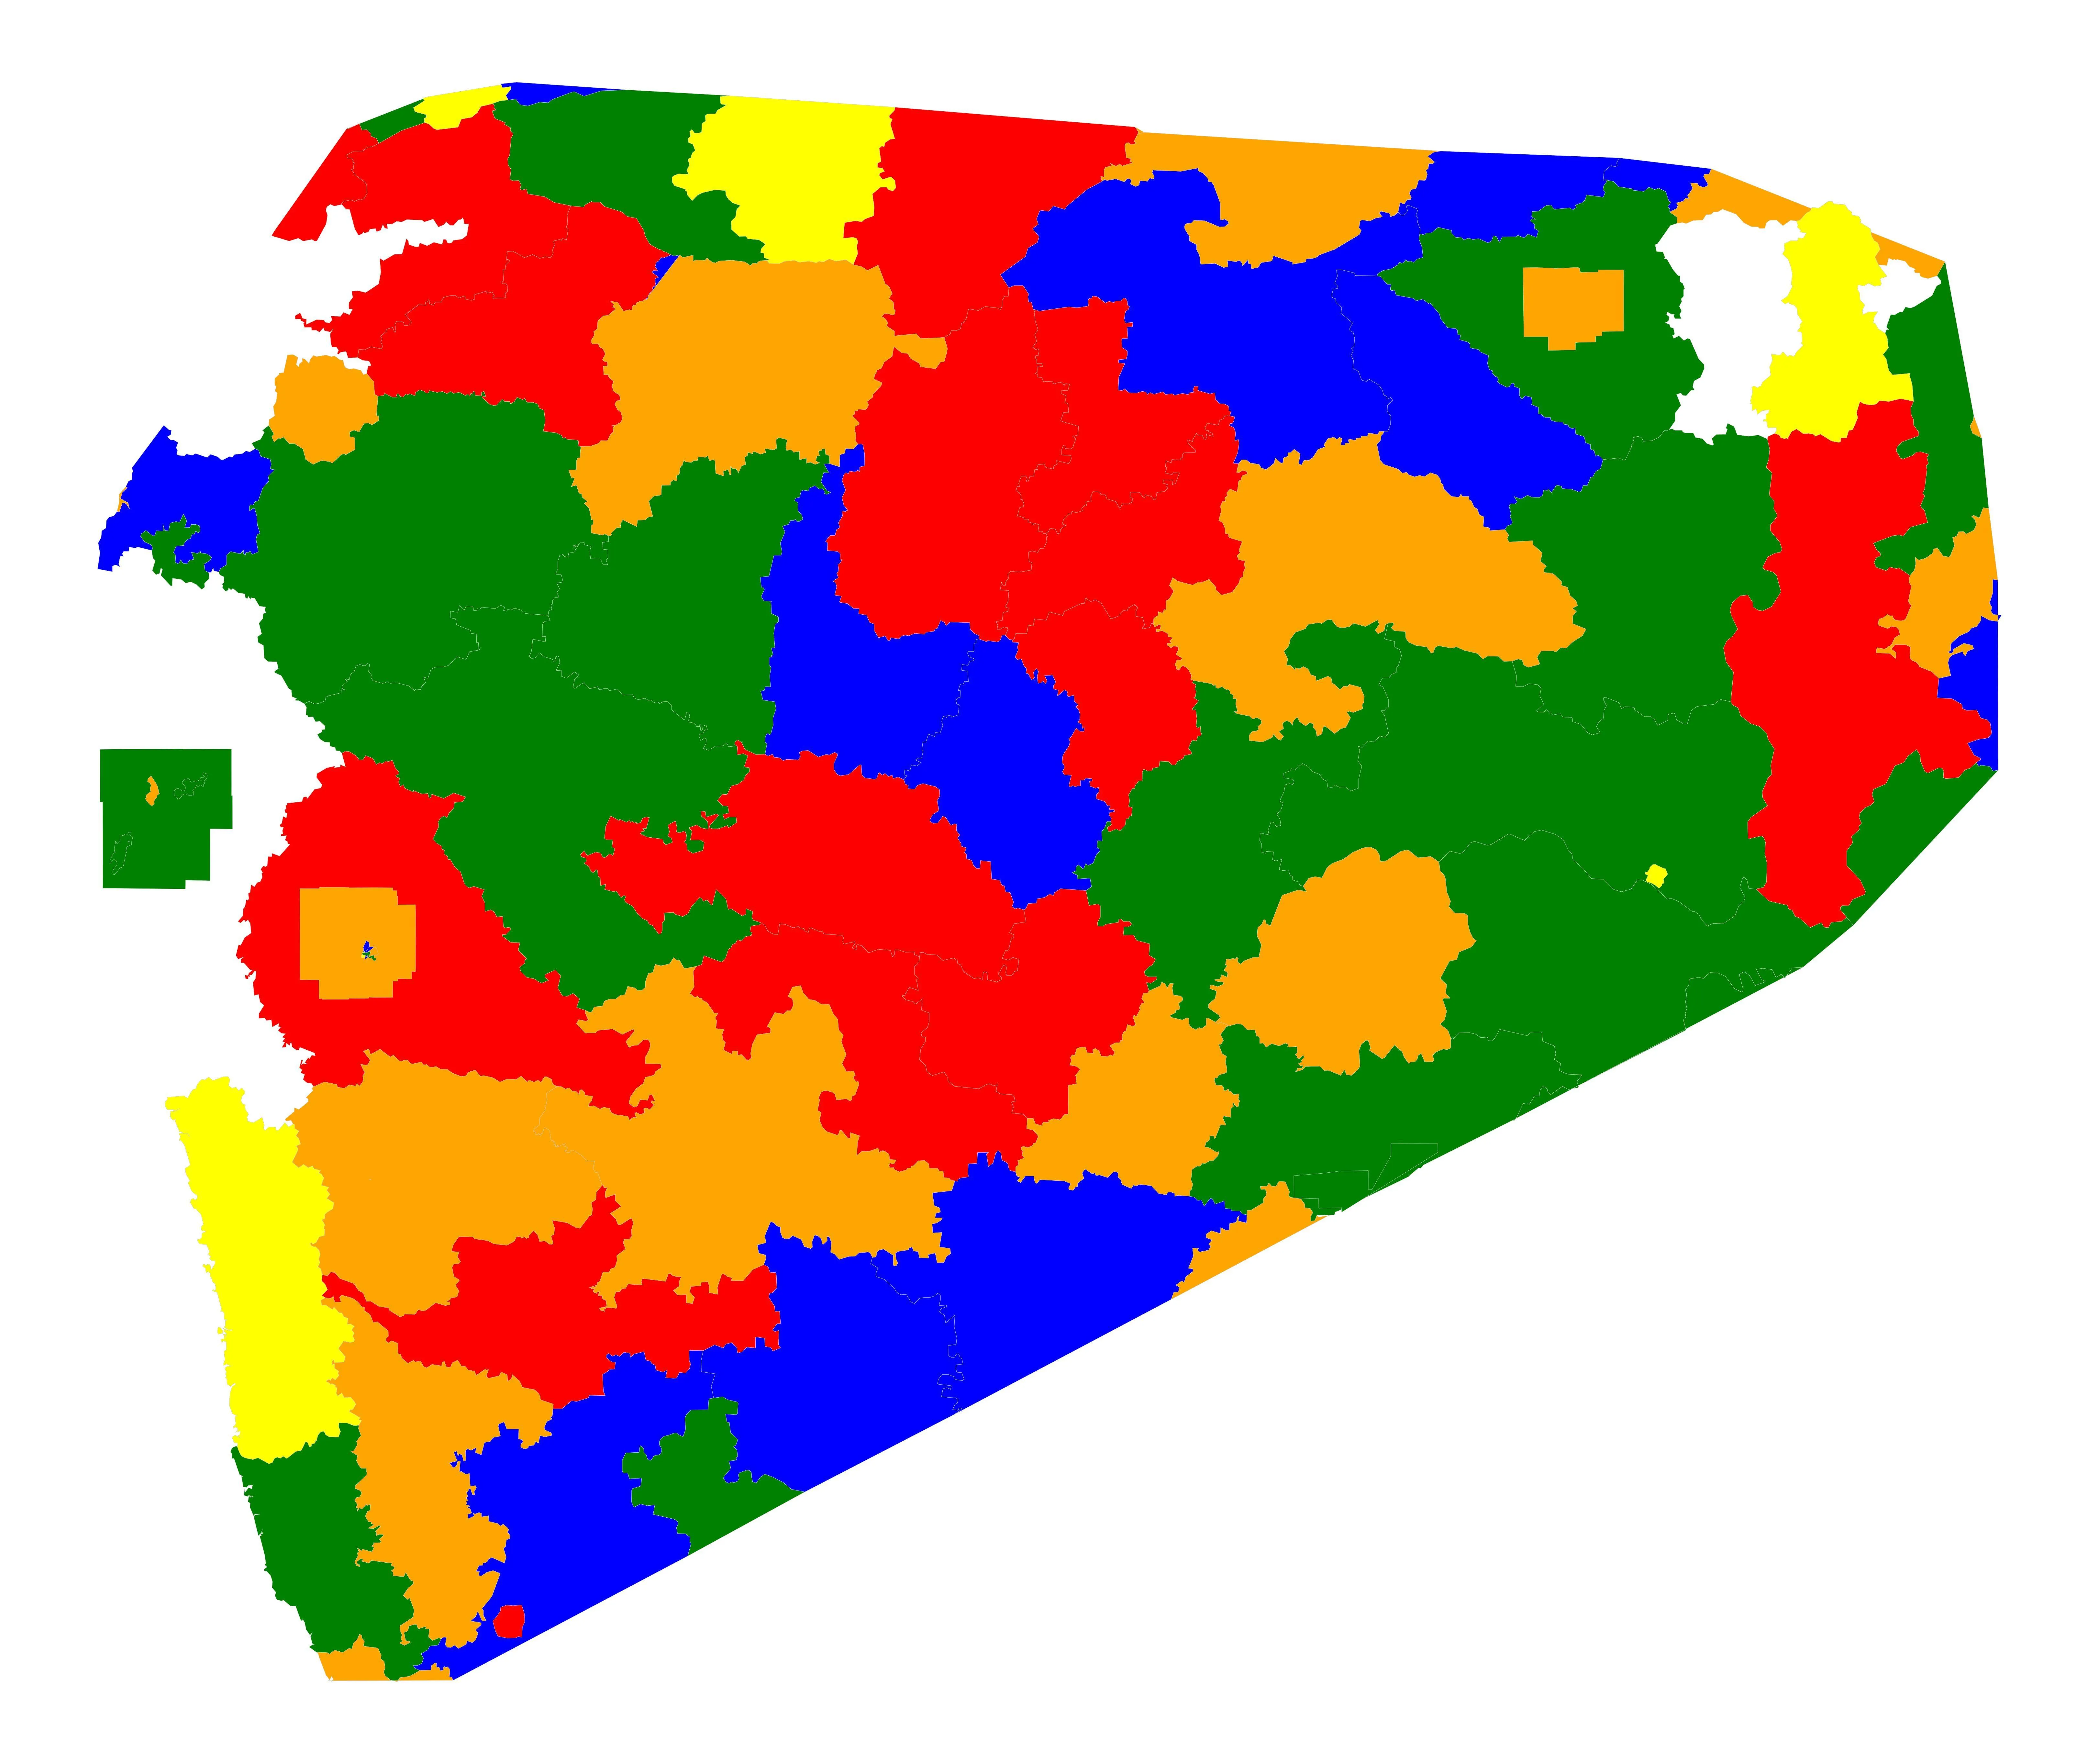
期望输出: 整张地图应该按照以下方式进行标记:
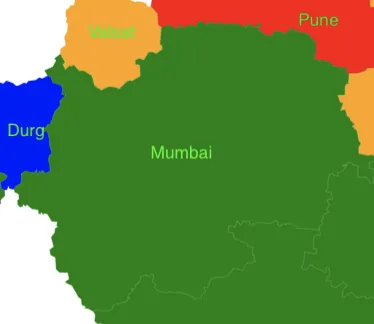
我想更改这张图片,使得map_df['NAME']中的值在相应行政区的绘图内部被标记。
任何帮助或建议将不胜感激。