我有一个垂直方向很长的pandas数据框,希望以漂亮的表格形式展示,并带有滚动条。我可以将所有行显示为表格,但是无法显示滚动条。
def data(x):
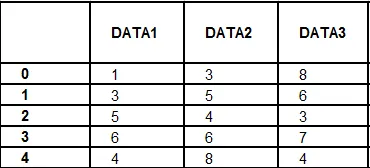
strData = strData[['Data1','Data2','Data3']]
display(strData)
输出:没有垂直滚动条
我有一个垂直方向很长的pandas数据框,希望以漂亮的表格形式展示,并带有滚动条。我可以将所有行显示为表格,但是无法显示滚动条。
def data(x):
strData = strData[['Data1','Data2','Data3']]
display(strData)
输出:没有垂直滚动条
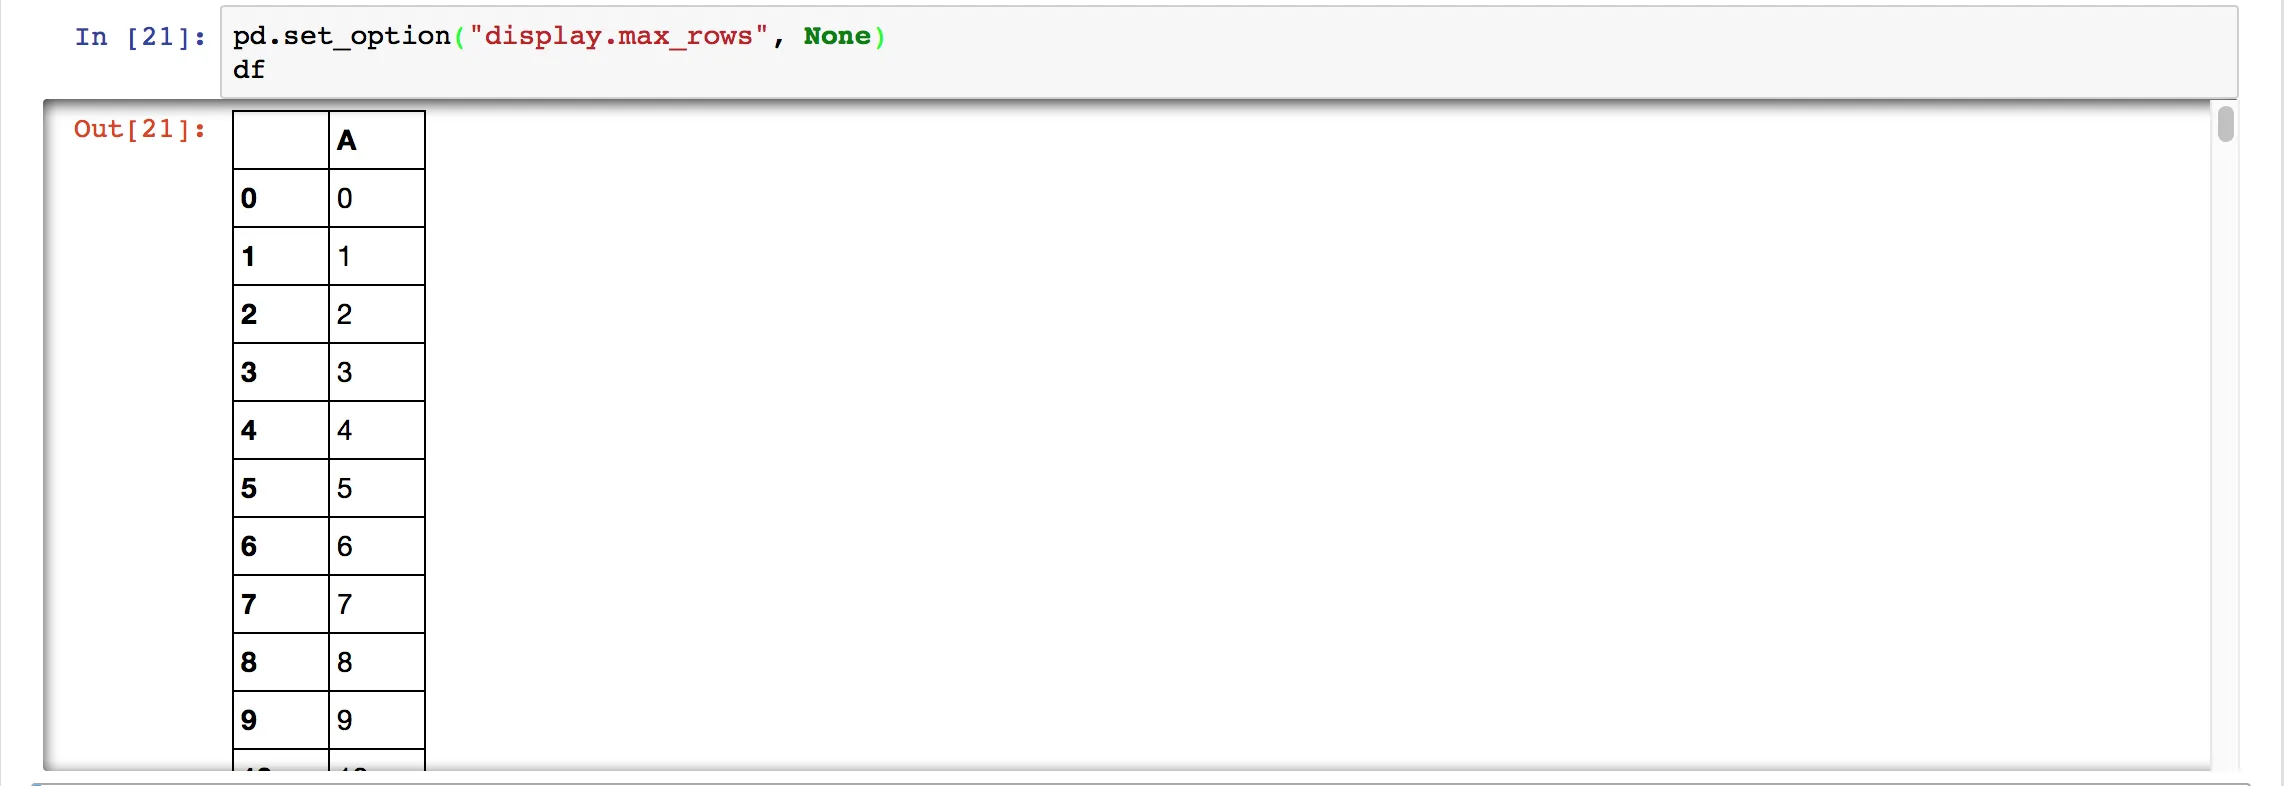
我不确定这是否是您的意思,但我猜您需要将max_rows选项设置为None,以便pandas不会限制显示的行数:
pd.set_option("display.max_rows", None)
更新:
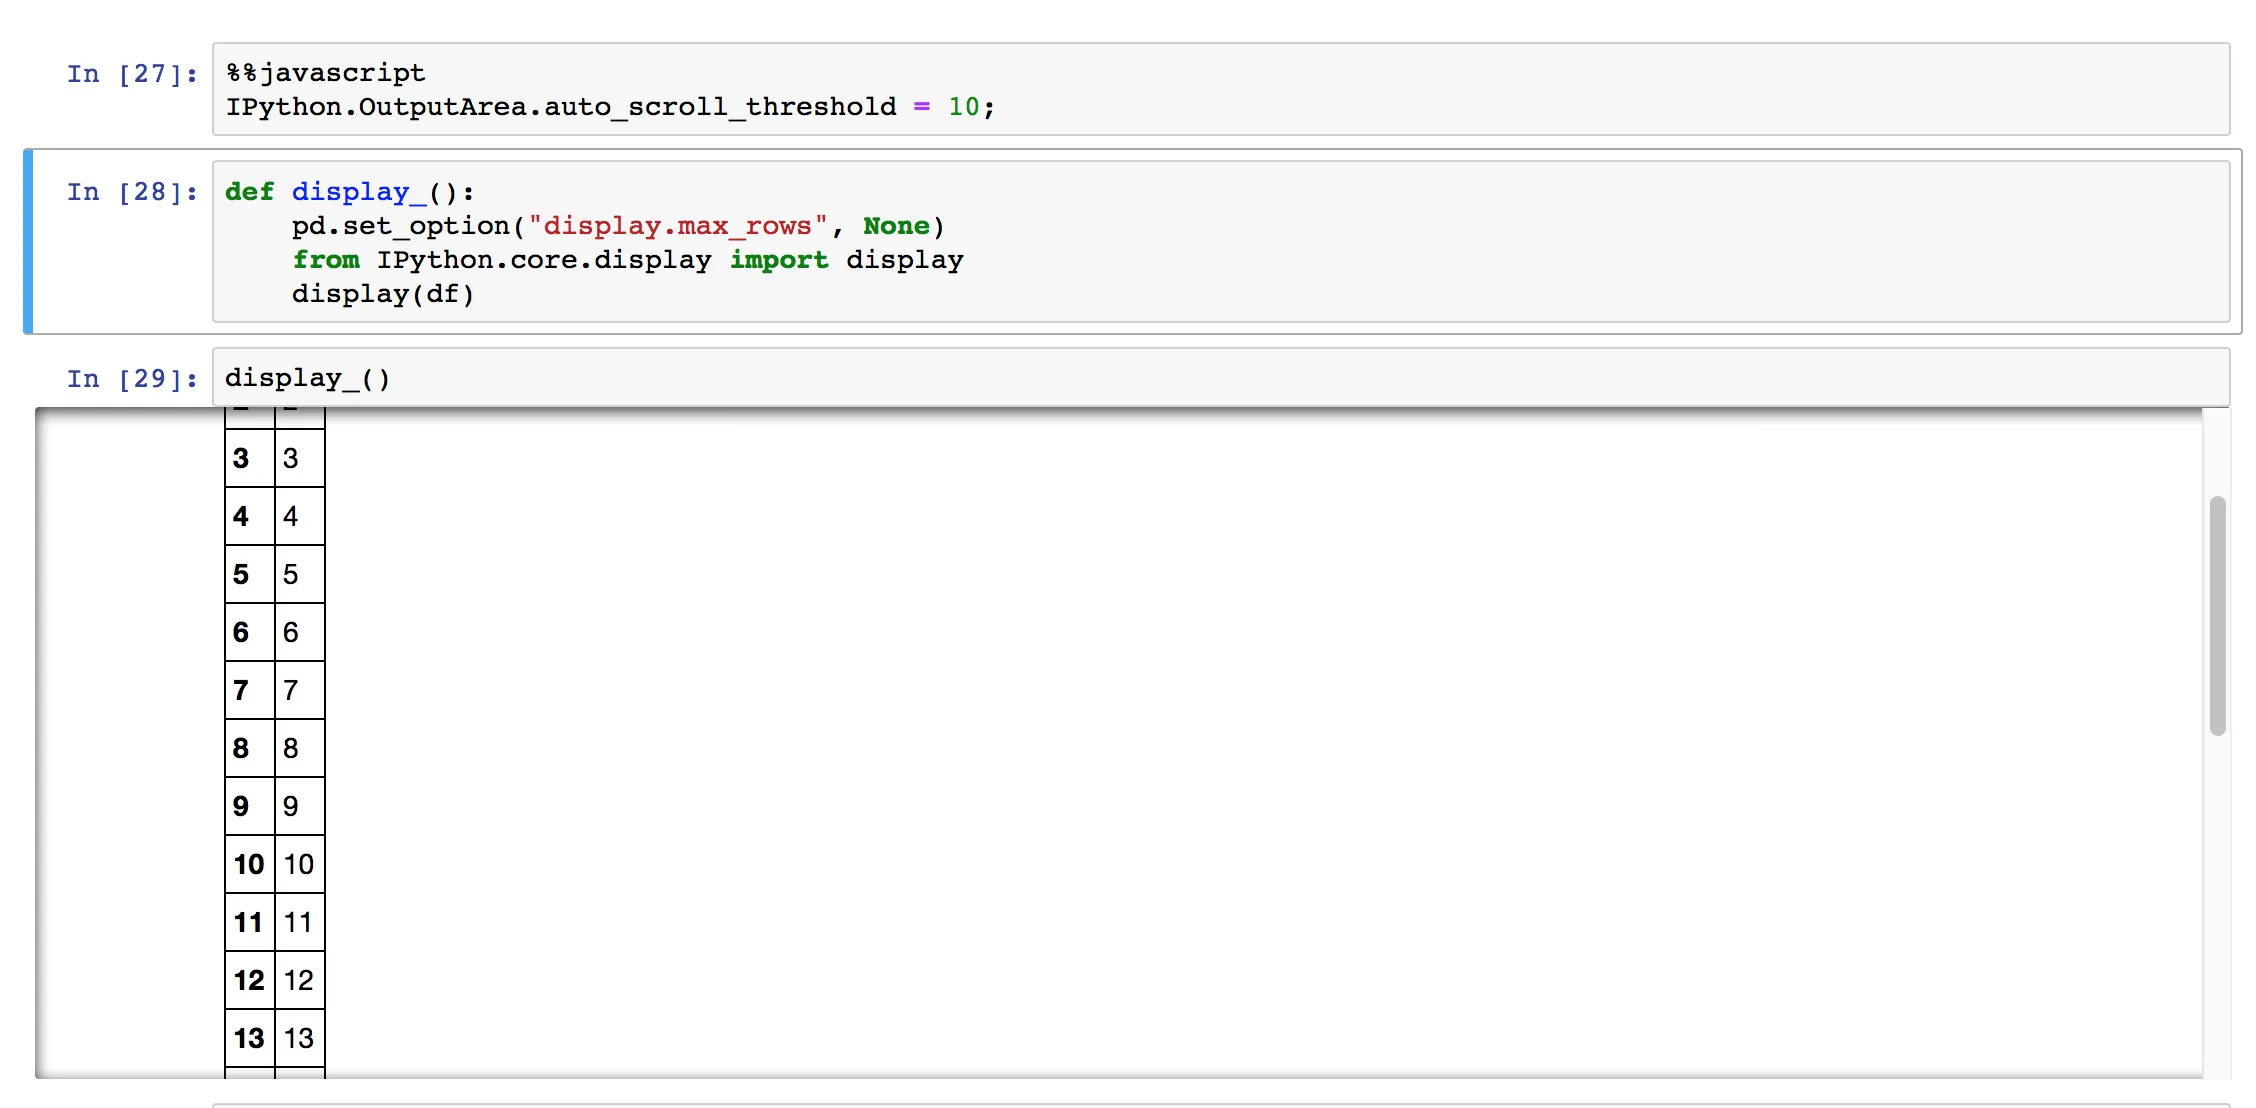
In [27]:
##javascript
IPython.OutputArea.auto_scroll_threshold = 10;

In[28]:
def display_():
    pd.set_option("display.max_rows", None)
    from IPython.core.display import display
    display(df) #df must be defined up there
另一个答案对我没用——IPython.OutputArea似乎不再存在(就我所知,至少在VSCode和基于IPython的代码中不再存在)。
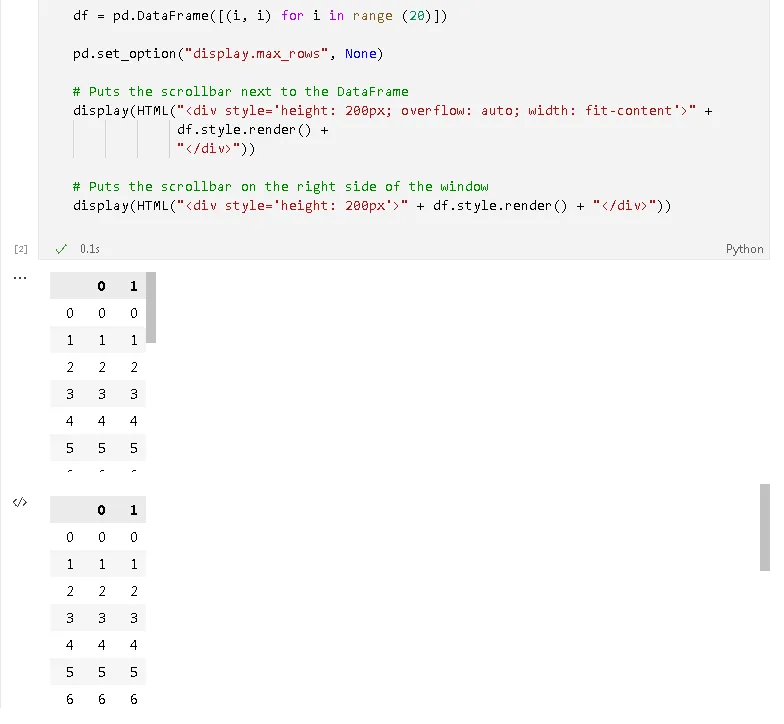
我用一种比较巧妙的方法使一个数据框可以滚动:生成数据框的HTML表格,然后将其放入一个 div 中,可以使用CSS使其可滚动。在这种情况下,我们只需要将高度设置为某个像素值即可。
我们还可以将溢出设置为auto,宽度设置为fit-content,以便滚动条出现在数据框旁边,而不是窗口右侧。
import pandas as pd
from IPython.display import display, HTML

df = pd.DataFrame([(i, i) for i in range (20)])

pd.set_option("display.max_rows", None)

# Puts the scrollbar next to the DataFrame
display(HTML("<div style='height: 200px; overflow: auto; width: fit-content'>" +
             df.style.render() +
             "</div>"))

# Puts the scrollbar on the right side of the window
display(HTML("<div style='height: 200px'>" + df.style.render() + "</div>"))
演示:
height 替换为 max-height,以防止表格在其中有少量项目时占用不必要的空间:display(HTML("<div style='max-height: 400px'>" + pd.DataFrame(records, columns=columns).to_html() + "</div>")) - zaaath只需传入数据框,观察魔力。
def table(df):
    import plotly.graph_objs as go
    fig = go.Figure(data=[go.Table(
    header=dict(values=list(df.columns),
                align='left'),
    cells=dict(values=[df[i] for i in df.columns],
                align='left'))
    ])
    return fig
import string
import numpy as np
import pandas as pd

N = 5000
cols = {char:np.random.randn(N) for char in string.ascii_lowercase[:5]}
df = pd.DataFrame(cols)
from ipydatagrid import DataGrid
DataGrid(df)
def display_(): pd.set_option("display.max_rows", None) from IPython.core.display import display display(df)- Psidom