如何在Python中制作多边形雷达(蜘蛛)图

17
import matplotlib.pyplot as plt
import numpy as np

labels=['Siege', 'Initiation', 'Crowd_control', 'Wave_clear', 'Objective_damage']
markers = [0, 1, 2, 3, 4, 5]
str_markers = ["0", "1", "2", "3", "4", "5"]

def make_radar_chart(name, stats, attribute_labels=labels,
                     plot_markers=markers, plot_str_markers=str_markers):

    labels = np.array(attribute_labels)

    angles = np.linspace(0, 2*np.pi, len(labels), endpoint=False)
    stats = np.concatenate((stats,[stats[0]]))
    angles = np.concatenate((angles,[angles[0]]))

    fig = plt.figure()
    ax = fig.add_subplot(111, polar=True)
    ax.plot(angles, stats, 'o-', linewidth=2)
    ax.fill(angles, stats, alpha=0.25)
    ax.set_thetagrids(angles * 180/np.pi, labels)
    plt.yticks(markers)
    ax.set_title(name)
    ax.grid(True)

    fig.savefig("static/images/%s.png" % name)

    return plt.show()

make_radar_chart("Agni", [2,3,4,4,5]) # example

enter image description here

enter image description here

基本上,我想让图表成为一个五边形而不是圆形。有人能帮忙吗?我正在使用Python Matplotlib保存一张图像,稍后将存储和显示它。我想让我的图表呈现出第二张图片的形式

编辑:

    gridlines = ax.yaxis.get_gridlines()
    for gl in gridlines:
        gl.get_path()._interpolation_steps = 5

以下回答中的代码部分有很大帮助。我得到了这张图表。仍需要弄清如何去除最外层的环:输入图像描述在此


我之前看过这个,但无法弄清楚如何实现他们的解决方案。 - David Ko
如果代码生成了所示的图像,那问题确切是什么?这到底与您想要的有多大不同? - ImportanceOfBeingErnest
“基本上我想让图表成为一个五边形而不是圆形。”还有标题中的“多边形”。我相信问题很清楚,原帖需要我提供的演示。 - Andras Deak -- Слава Україні
1
很遗憾,我无法在matplotlib 3.3或更高版本中重现此问题。这些圆仍然存在。有其他解决方法吗? - Daniel Saad
有人在matplotlib 3.3或更高版本上找到了如何做到这一点吗?我深入研究了matplotlib源代码,但还没有弄清楚。 - Superbman
显示剩余8条评论
2个回答

21

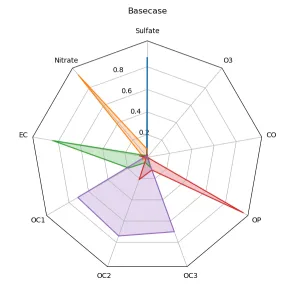
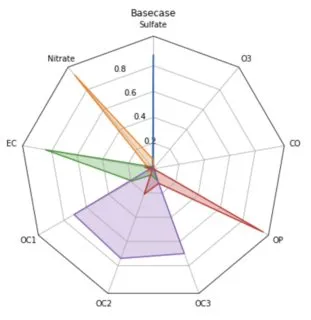
雷达图演示展示了如何制作一个雷达图。结果看起来像这样:

enter image description here

在这里,外部轮廓为多边形,但内部网格线是圆形的。因此,现在的问题是如何将网格线的形状与轮廓相同。

可以通过覆盖draw方法并将网格线的路径插值步骤变量设置为 RadarAxes类的变量数量来实现。

gridlines = self.yaxis.get_gridlines()
for gl in gridlines:
    gl.get_path()._interpolation_steps = num_vars

完整示例:

import numpy as np

import matplotlib.pyplot as plt
from matplotlib.patches import Circle, RegularPolygon
from matplotlib.path import Path
from matplotlib.projections.polar import PolarAxes
from matplotlib.projections import register_projection
from matplotlib.spines import Spine
from matplotlib.transforms import Affine2D


def radar_factory(num_vars, frame='circle'):
    """Create a radar chart with `num_vars` axes.

    This function creates a RadarAxes projection and registers it.

    Parameters
    ----------
    num_vars : int
        Number of variables for radar chart.
    frame : {'circle' | 'polygon'}
        Shape of frame surrounding axes.

    """
    # calculate evenly-spaced axis angles
    theta = np.linspace(0, 2*np.pi, num_vars, endpoint=False)

    class RadarAxes(PolarAxes):

        name = 'radar'

        def __init__(self, *args, **kwargs):
            super().__init__(*args, **kwargs)
            # rotate plot such that the first axis is at the top
            self.set_theta_zero_location('N')

        def fill(self, *args, closed=True, **kwargs):
            """Override fill so that line is closed by default"""
            return super().fill(closed=closed, *args, **kwargs)

        def plot(self, *args, **kwargs):
            """Override plot so that line is closed by default"""
            lines = super().plot(*args, **kwargs)
            for line in lines:
                self._close_line(line)

        def _close_line(self, line):
            x, y = line.get_data()
            # FIXME: markers at x[0], y[0] get doubled-up
            if x[0] != x[-1]:
                x = np.concatenate((x, [x[0]]))
                y = np.concatenate((y, [y[0]]))
                line.set_data(x, y)

        def set_varlabels(self, labels):
            self.set_thetagrids(np.degrees(theta), labels)

        def _gen_axes_patch(self):
            # The Axes patch must be centered at (0.5, 0.5) and of radius 0.5
            # in axes coordinates.
            if frame == 'circle':
                return Circle((0.5, 0.5), 0.5)
            elif frame == 'polygon':
                return RegularPolygon((0.5, 0.5), num_vars,
                                      radius=.5, edgecolor="k")
            else:
                raise ValueError("unknown value for 'frame': %s" % frame)

        def draw(self, renderer):
            """ Draw. If frame is polygon, make gridlines polygon-shaped """
            if frame == 'polygon':
                gridlines = self.yaxis.get_gridlines()
                for gl in gridlines:
                    gl.get_path()._interpolation_steps = num_vars
            super().draw(renderer)


        def _gen_axes_spines(self):
            if frame == 'circle':
                return super()._gen_axes_spines()
            elif frame == 'polygon':
                # spine_type must be 'left'/'right'/'top'/'bottom'/'circle'.
                spine = Spine(axes=self,
                              spine_type='circle',
                              path=Path.unit_regular_polygon(num_vars))
                # unit_regular_polygon gives a polygon of radius 1 centered at
                # (0, 0) but we want a polygon of radius 0.5 centered at (0.5,
                # 0.5) in axes coordinates.
                spine.set_transform(Affine2D().scale(.5).translate(.5, .5)
                                    + self.transAxes)


                return {'polar': spine}
            else:
                raise ValueError("unknown value for 'frame': %s" % frame)

    register_projection(RadarAxes)
    return theta


data = [['Sulfate', 'Nitrate', 'EC', 'OC1', 'OC2', 'OC3', 'OP', 'CO', 'O3'],
        ('Basecase', [
            [0.88, 0.01, 0.03, 0.03, 0.00, 0.06, 0.01, 0.00, 0.00],
            [0.07, 0.95, 0.04, 0.05, 0.00, 0.02, 0.01, 0.00, 0.00],
            [0.01, 0.02, 0.85, 0.19, 0.05, 0.10, 0.00, 0.00, 0.00],
            [0.02, 0.01, 0.07, 0.01, 0.21, 0.12, 0.98, 0.00, 0.00],
            [0.01, 0.01, 0.02, 0.71, 0.74, 0.70, 0.00, 0.00, 0.00]])]

N = len(data[0])
theta = radar_factory(N, frame='polygon')

spoke_labels = data.pop(0)
title, case_data = data[0]

fig, ax = plt.subplots(figsize=(6, 6), subplot_kw=dict(projection='radar'))
fig.subplots_adjust(top=0.85, bottom=0.05)

ax.set_rgrids([0.2, 0.4, 0.6, 0.8])
ax.set_title(title,  position=(0.5, 1.1), ha='center')

for d in case_data:
    line = ax.plot(theta, d)
    ax.fill(theta, d,  alpha=0.25)
ax.set_varlabels(spoke_labels)

plt.show()

在此输入图片描述


这段代码在Python 2和3中都会出现语法错误,具体是哪里有问题呢?我运行了示例代码,发现报错信息指向了这一行:def fill(self, *args, closed=True, **kwargs):。请问我漏掉了什么吗? - flashliquid
2
我怎么知道缺少了什么?这个例子本来就可以正常工作。 - ImportanceOfBeingErnest
当您将最大网格值设置为0.8,并将数据中的最大值设置为0.8时,您会发现线条没有绘制在角落处。我该如何解决这个问题?不过这似乎是一个matplotlib的问题.... - Jeroen
Matplotlib默认使用5%的边距。如果需要,您可以更改它,或手动设置限制。 - ImportanceOfBeingErnest
在matplotlib>=3.3.3中,此方法不起作用。您需要降级到3.2.2版本。 - Yann Dubois
显示剩余2条评论

1

正如其他帖子中所示,@ImportanceOfBeingErnest的答案在matplotlib>3.2.2中不起作用,因为你会得到圆形网格。正如PR中所示,你可以使用以下方法:

import numpy as np

import matplotlib.pyplot as plt
from matplotlib.patches import Circle, RegularPolygon
from matplotlib.path import Path
from matplotlib.projections.polar import PolarAxes
from matplotlib.projections import register_projection
from matplotlib.spines import Spine
from matplotlib.transforms import Affine2D


def radar_factory(num_vars, frame='circle'):
    """Create a radar chart with `num_vars` axes.

    This function creates a RadarAxes projection and registers it.

    Parameters
    ----------
    num_vars : int
        Number of variables for radar chart.
    frame : {'circle' | 'polygon'}
        Shape of frame surrounding axes.

    """
    # calculate evenly-spaced axis angles
    theta = np.linspace(0, 2*np.pi, num_vars, endpoint=False)
    
    class RadarTransform(PolarAxes.PolarTransform):
        def transform_path_non_affine(self, path):
            # Paths with non-unit interpolation steps correspond to gridlines,
            # in which case we force interpolation (to defeat PolarTransform's
            # autoconversion to circular arcs).
            if path._interpolation_steps > 1:
                path = path.interpolated(num_vars)
            return Path(self.transform(path.vertices), path.codes)

    class RadarAxes(PolarAxes):

        name = 'radar'
        
        PolarTransform = RadarTransform

        def __init__(self, *args, **kwargs):
            super().__init__(*args, **kwargs)
            # rotate plot such that the first axis is at the top
            self.set_theta_zero_location('N')

        def fill(self, *args, closed=True, **kwargs):
            """Override fill so that line is closed by default"""
            return super().fill(closed=closed, *args, **kwargs)

        def plot(self, *args, **kwargs):
            """Override plot so that line is closed by default"""
            lines = super().plot(*args, **kwargs)
            for line in lines:
                self._close_line(line)

        def _close_line(self, line):
            x, y = line.get_data()
            # FIXME: markers at x[0], y[0] get doubled-up
            if x[0] != x[-1]:
                x = np.concatenate((x, [x[0]]))
                y = np.concatenate((y, [y[0]]))
                line.set_data(x, y)

        def set_varlabels(self, labels):
            self.set_thetagrids(np.degrees(theta), labels)

        def _gen_axes_patch(self):
            # The Axes patch must be centered at (0.5, 0.5) and of radius 0.5
            # in axes coordinates.
            if frame == 'circle':
                return Circle((0.5, 0.5), 0.5)
            elif frame == 'polygon':
                return RegularPolygon((0.5, 0.5), num_vars,
                                      radius=.5, edgecolor="k")
            else:
                raise ValueError("unknown value for 'frame': %s" % frame)

        def draw(self, renderer):
            """ Draw. If frame is polygon, make gridlines polygon-shaped """
            if frame == 'polygon':
                gridlines = self.yaxis.get_gridlines()
                for gl in gridlines:
                    gl.get_path()._interpolation_steps = num_vars
            super().draw(renderer)


        def _gen_axes_spines(self):
            if frame == 'circle':
                return super()._gen_axes_spines()
            elif frame == 'polygon':
                # spine_type must be 'left'/'right'/'top'/'bottom'/'circle'.
                spine = Spine(axes=self,
                              spine_type='circle',
                              path=Path.unit_regular_polygon(num_vars))
                # unit_regular_polygon gives a polygon of radius 1 centered at
                # (0, 0) but we want a polygon of radius 0.5 centered at (0.5,
                # 0.5) in axes coordinates.
                spine.set_transform(Affine2D().scale(.5).translate(.5, .5)
                                    + self.transAxes)


                return {'polar': spine}
            else:
                raise ValueError("unknown value for 'frame': %s" % frame)

    register_projection(RadarAxes)
    return theta


data = [['Sulfate', 'Nitrate', 'EC', 'OC1', 'OC2', 'OC3', 'OP', 'CO', 'O3'],
        ('Basecase', [
            [0.88, 0.01, 0.03, 0.03, 0.00, 0.06, 0.01, 0.00, 0.00],
            [0.07, 0.95, 0.04, 0.05, 0.00, 0.02, 0.01, 0.00, 0.00],
            [0.01, 0.02, 0.85, 0.19, 0.05, 0.10, 0.00, 0.00, 0.00],
            [0.02, 0.01, 0.07, 0.01, 0.21, 0.12, 0.98, 0.00, 0.00],
            [0.01, 0.01, 0.02, 0.71, 0.74, 0.70, 0.00, 0.00, 0.00]])]

N = len(data[0])
theta = radar_factory(N, frame='polygon')

spoke_labels = data.pop(0)
title, case_data = data[0]

fig, ax = plt.subplots(figsize=(6, 6), subplot_kw=dict(projection='radar'))
fig.subplots_adjust(top=0.85, bottom=0.05)

ax.set_rgrids([0.2, 0.4, 0.6, 0.8])
ax.set_title(title,  position=(0.5, 1.1), ha='center')

for d in case_data:
    line = ax.plot(theta, d)
    ax.fill(theta, d, alpha=0.25, label='_nolegend_')
ax.set_varlabels(spoke_labels)

plt.show()

获得所需内容:

enter image description here


网页内容由stack overflow 提供, 点击上面的
可以查看英文原文,
原文链接