我有一个2D的numpy数组,想要在3D中进行绘制。我听说过mplot3d,但无法使其正常工作。
这是我想要做的示例。我有一个尺寸为(256,1024)的数组。应该绘制一个3D图形,其中x轴从0到256,y轴从0到1024,而图形的z轴显示每个条目处数组的值。
我该怎么做呢?
听起来你想创建一个surface图(或者你可以绘制一个wireframe图或一个filled countour plot)。
从问题中的信息来看,你可以尝试以下方法:
import numpy
import matplotlib.pyplot as plt
from mpl_toolkits.mplot3d import Axes3D

# Set up grid and test data
nx, ny = 256, 1024
x = range(nx)
y = range(ny)

data = numpy.random.random((nx, ny))

hf = plt.figure()
ha = hf.add_subplot(111, projection='3d')

X, Y = numpy.meshgrid(x, y)  # `plot_surface` expects `x` and `y` data to be 2D
ha.plot_surface(X, Y, data)

plt.show()
numpy.random更明智的数据。from mpl_toolkits.mplot3d import axes3d
import matplotlib.pyplot as plt
import numpy as np
%matplotlib inline
np.random.seed(1234)
fig = plt.figure()
ax1 = fig.add_subplot(111, projection='3d')
A = np.random.randint(5, size=(25, 10))
x = np.array([[i] * 10 for i in range(25)]).ravel() # x coordinates of each bar
y = np.array([i for i in range(10)] * 25) # y coordinates of each bar
z = np.zeros(25*10) # z coordinates of each bar
dx = np.ones(25*10) # length along x-axis of each bar
dy = np.ones(25*10) # length along y-axis of each bar
dz = A.ravel() # length along z-axis of each bar (height)
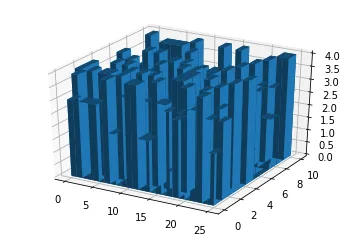
ax1.bar3d(x, y, z, dx, dy, dz)
在我设定种子为1234的电脑上,我得到了以下图表:
但是,如果你的问题维度为(256,1024),制作这张图可能会很慢。
meshgrid())。from oct2py import octave as oc
tx = ty = oc.linspace (-8, 8, 41)
[xx, yy] = oc.meshgrid (tx, ty)
r = oc.sqrt (xx * xx + yy * yy) + oc.eps()
tz = oc.sin (r) / r
oc.mesh (tx, ty, tz)
data,它的大小被称为nx、ny。希望这可以让你开始工作。 - Eric O. Lebigotha.plot_surface(X.T, Y.T, data)。然后您将得到一个正确的结果。 - zwep