使用对数刻度绘制mplot3d / axes3D xyz曲面图?

23

我一直在寻找一个解决这个简单问题的方法,但是无论我到哪里都找不到!有很多帖子详细介绍了在二维中使用半对数 / 对数-对数绘图的方法,例如plt.setxscale('log'),但我想在3D绘图(mplot3d)上使用对数尺度。

我手头没有精确的代码,所以不能在这里发布它,但下面的简单示例应该足以说明情况。 我目前正在使用Matplotlib 0.99.1,但很快就会更新到1.0.0 - 我知道我将不得不更新我的代码以适应mplot3d的实现。

from mpl_toolkits.mplot3d import Axes3D
from matplotlib import cm
from matplotlib.ticker import LinearLocator, FixedLocator, FormatStrFormatter
import matplotlib.pyplot as plt
import numpy as np

fig = plt.figure()
ax = Axes3D(fig)
X = np.arange(-5, 5, 0.025)
Y = np.arange(-5, 5, 0.025)
X, Y = np.meshgrid(X, Y)
R = np.sqrt(X**2 + Y**2)
Z = np.sin(R)
surf = ax.plot_surface(X, Y, Z, rstride=1, cstride=1, cmap=cm.jet, extend3d=True)
ax.set_zlim3d(-1.01, 1.01)

ax.w_zaxis.set_major_locator(LinearLocator(10))
ax.w_zaxis.set_major_formatter(FormatStrFormatter('%.03f'))

fig.colorbar(surf)

plt.show()
上述代码可以在3D中很好地绘制,但三个刻度(X、Y、Z)都是线性的。我的“Y”数据跨越几个数量级(如9!),因此将其绘制在对数刻度上会非常有用。我可以通过获取'Y'的对数值,重新创建numpy数组并在线性刻度上绘制log(Y)来解决这个问题,但按照真正的Python风格,我正在寻找更智能的解决方案,可以在对数刻度上绘制数据。

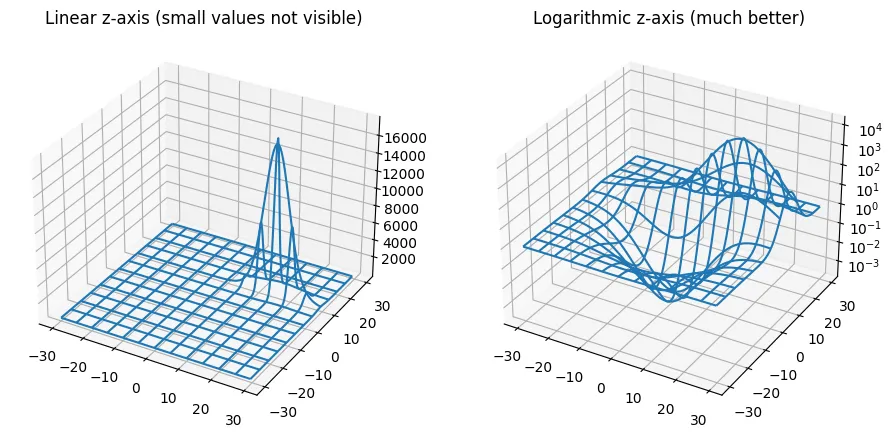
是否可能使用对数刻度生成我的XYZ数据的3D曲面图?理想情况下,我希望X和Z处于线性比例尺上,而Y则在对数比例尺上。

任何帮助都将不胜感激。请原谅上面示例中可能存在的任何明显错误,就像我所提到的那样,我没有确切的代码可供参考,因此从我的记忆中更改了一个matplotlib画廊示例。

谢谢

5个回答

13

由于我遇到了相同的问题,Alejandro的答案没有产生预期的结果,所以迄今为止我发现了以下内容。

在matplotlib中,3D轴的对数缩放是一个持续存在的问题。目前,您只能使用以下方法重新标签化坐标轴:

ax.yaxis.set_scale('log')

然而,这不会使轴按对数标度缩放,而是标记为对数。ax.set_yscale('log') 将在3D中导致异常。

请见github上的问题209

因此,您仍然需要重新创建NumPy数组。


这个问题有已知的解决方案吗?似乎在3D中set_yscale仍然无效。 - Blink
@Blink:我不这么认为。:( - balu
26
ењЁOSXдёЉе‡єзЋ°дє†AttributeError: 'YAxis'еЇ№и±ЎжІЎжњ‰е±ћжЂ§'set_scale'гЂ‚ - ethanabrooks
我在Linux中遇到了相同的AttributeError错误。 - swimfar2
我在Linux中遇到了相同的AttributeError错误。 - undefined

13

我从问题 209 中获得灵感,提出了一个简单易行的解决方案。您可以定义一个小型格式化函数,在其中设置自己的符号。

import matplotlib.ticker as mticker

# My axis should display 10⁻¹ but you can switch to e-notation 1.00e+01
def log_tick_formatter(val, pos=None):
    return f"$10^{{{int(val)}}}$"  # remove int() if you don't use MaxNLocator
    # return f"{10**val:.2e}"      # e-Notation

ax.zaxis.set_major_formatter(mticker.FuncFormatter(log_tick_formatter))
ax.zaxis.set_major_locator(mticker.MaxNLocator(integer=True))
set_major_locator函数用于设置指数,只使用10⁻¹、10⁻²等整数,不使用10^-1.5等。 来源 重要提示!如果您不使用set_major_locator并且要显示10^-1.5,则请在返回语句中删除int()转换,否则它仍将打印10⁻¹而不是10^-1.5。 示例:LinearLog

试一试吧!

from mpl_toolkits.mplot3d import axes3d
import numpy as np
import matplotlib.pyplot as plt
import matplotlib.ticker as mticker

fig = plt.figure(figsize=(11,8))
ax1 = fig.add_subplot(121,projection="3d")

# Grab some test data.
X, Y, Z = axes3d.get_test_data(0.05)
# Now Z has a range from 10⁻³ until 10³, so 6 magnitudes
Z = (np.full((120, 120), 10)) ** (Z / 20)
ax1.plot_wireframe(X, Y, Z, rstride=10, cstride=10)
ax1.set(title="Linear z-axis (small values not visible)")


def log_tick_formatter(val, pos=None):
    return f"$10^{{{int(val)}}}$"


ax2 = fig.add_subplot(122,projection="3d")

# You still have to take log10(Z) but thats just one operation
ax2.plot_wireframe(X, Y, np.log10(Z), rstride=10, cstride=10)
ax2.zaxis.set_major_formatter(mticker.FuncFormatter(log_tick_formatter))
ax2.zaxis.set_major_locator(mticker.MaxNLocator(integer=True))
ax2.set(title="Logarithmic z-axis (much better)")
plt.savefig("LinearLog.png", bbox_inches='tight')
plt.show()


1
我认为你最好将自定义格式化程序定义为 def log_tick_formatter(val, pos=None): return f"$10^{{{val:g}}}$",而不是使用 int(...) 结构。这个刻度格式化程序将适用于 integer=Trueinteger=False - Bastian
1
不使用 int(...) 构造的优点是,输出结果对于像 Z = (np.full((120, 120), 10)) ** (Z / 20) + 1e3 这样的数据也会合理,而 mticker.MaxNLocator 无法考虑到 integer=True - Bastian

8
在OSX中:运行ax.zaxis._set_scale('log')(注意下划线)。

1
这只是在对数刻度上标记轴,而不是实际绘制对数刻度。 - zyy

1

由于209问题,目前没有解决方案。不过,您可以尝试以下方法:

ax.plot_surface(X, np.log10(Y), Z, cmap='jet', linewidth=0.5)

如果在“Y”中有一个0,它会出现一个警告但仍然工作。由于这个警告,颜色映射不起作用,因此请尽量避免0和负数。例如:
   Y[Y != 0] = np.log10(Y[Y != 0])
ax.plot_surface(X, Y, Z, cmap='jet', linewidth=0.5)

1

我需要一个symlog图,由于我手动填充数据数组,因此我编写了一个自定义函数来计算对数,以避免在bar3d中出现负条形图,如果数据小于1:

import math as math

def manual_log(data):
  if data < 10: # Linear scaling up to 1
    return data/10
  else: # Log scale above 1
    return math.log10(data)

由于我没有负值,所以在这个函数中没有实现处理这些值的功能,但更改应该不难。


网页内容由stack overflow 提供, 点击上面的
可以查看英文原文,
原文链接