在 ggplot 上绘制对数-对数比例尺下的线性函数

7

我想在R语言(Ver 3.0.2)中使用ggplot2(Ver 0.9.3.1)绘制三个函数的对数-对数图。

y = x
y = 0.5*x
y = 1.5*x

我尝试了很多方法,但总是遇到问题。这包括阅读stackoverflow上的问题here
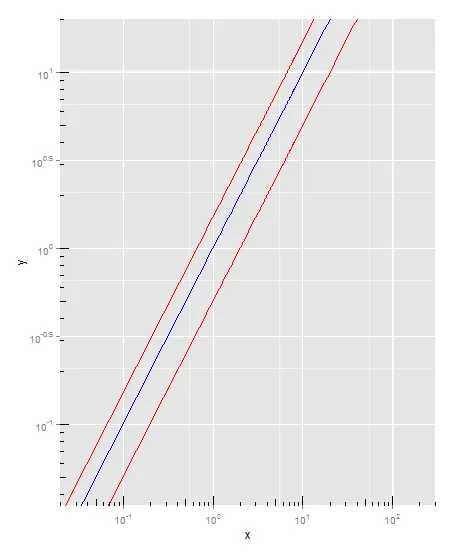
我想要的一个示例在这里。我在Matlab中生成了那个图。
以下是我正在使用的代码示例,但目前它没有绘制任何内容。最终,我希望它成为其他数据的一层(需要对数-对数来显示结构)。
library(ggplot2)

plot = ggplot()
plot = plot + coord_cartesian(xlim = c(0.02, 300), ylim = c(0.035, 20))
plot = plot + stat_function(data = data.frame(x=c(0,1000), y=c(0,1)), fun=function(x) {x}, aes(x,y), geom = "line", color = "blue")
plot = plot + stat_function(data = data.frame(x=c(0,1000), y=c(0,1)), fun=function(x) {0.5*x}, aes(x,y), geom = "line", color = "red")
plot = plot + stat_function(data = data.frame(x=c(0,1000), y=c(0,1)), fun=function(x) {1.5*x}, aes(x,y), geom = "line", color = "red")
plot = plot + scale_x_log10() + scale_y_log10() + annotation_logticks()
plot  

为什么不使用aes(log(x, 10), log(y, 10))代替aes(x, y)呢? - Ricardo Saporta
1个回答

11
你可以使用 coord_trans 来替代 scale_.._log10coord_cartesian。类似于以下示例(使用来自 annotation_logticks 的示例以适当标记断点)。
ggplot(data =  data.frame(x=c(0.0001,1000), y=c(0.001,1)), aes(x=x,y=y)) +
   stat_function(fun = function(x) x, geom='line',colour ='blue') +
   stat_function(fun = function(x) 0.5*x, geom='line',colour = 'red') +
   stat_function(fun = function(x) 1.5 * x , geom = 'line', colour = 'red') +
   coord_trans(xtrans = 'log10',ytrans = 'log10', limx = c(0.02,300), limy =c(0.035,20)) +
  annotation_logticks(scaled=FALSE) +
   scale_x_continuous(breaks = trans_breaks("log10", function(x) 10^x),
                labels = trans_format("log10", math_format(10^.x))) +
  scale_y_continuous(breaks = trans_breaks("log10", function(x) 10^x),
                     labels = trans_format("log10", math_format(10^.x)))

enter image description here

请注意,?annotation_logticks 提供了多种解决此问题的方法。


太好了!我把它放进去,然后加入了其他代码,现在它可以工作了...感谢您的反馈! - Justace Clutter

网页内容由stack overflow 提供, 点击上面的
可以查看英文原文,
原文链接