我需要使用R中的ggplot2包来绘制带有负值的图表,并使用对数刻度x轴。
例如,我想使用对数刻度x轴来绘制这些点:
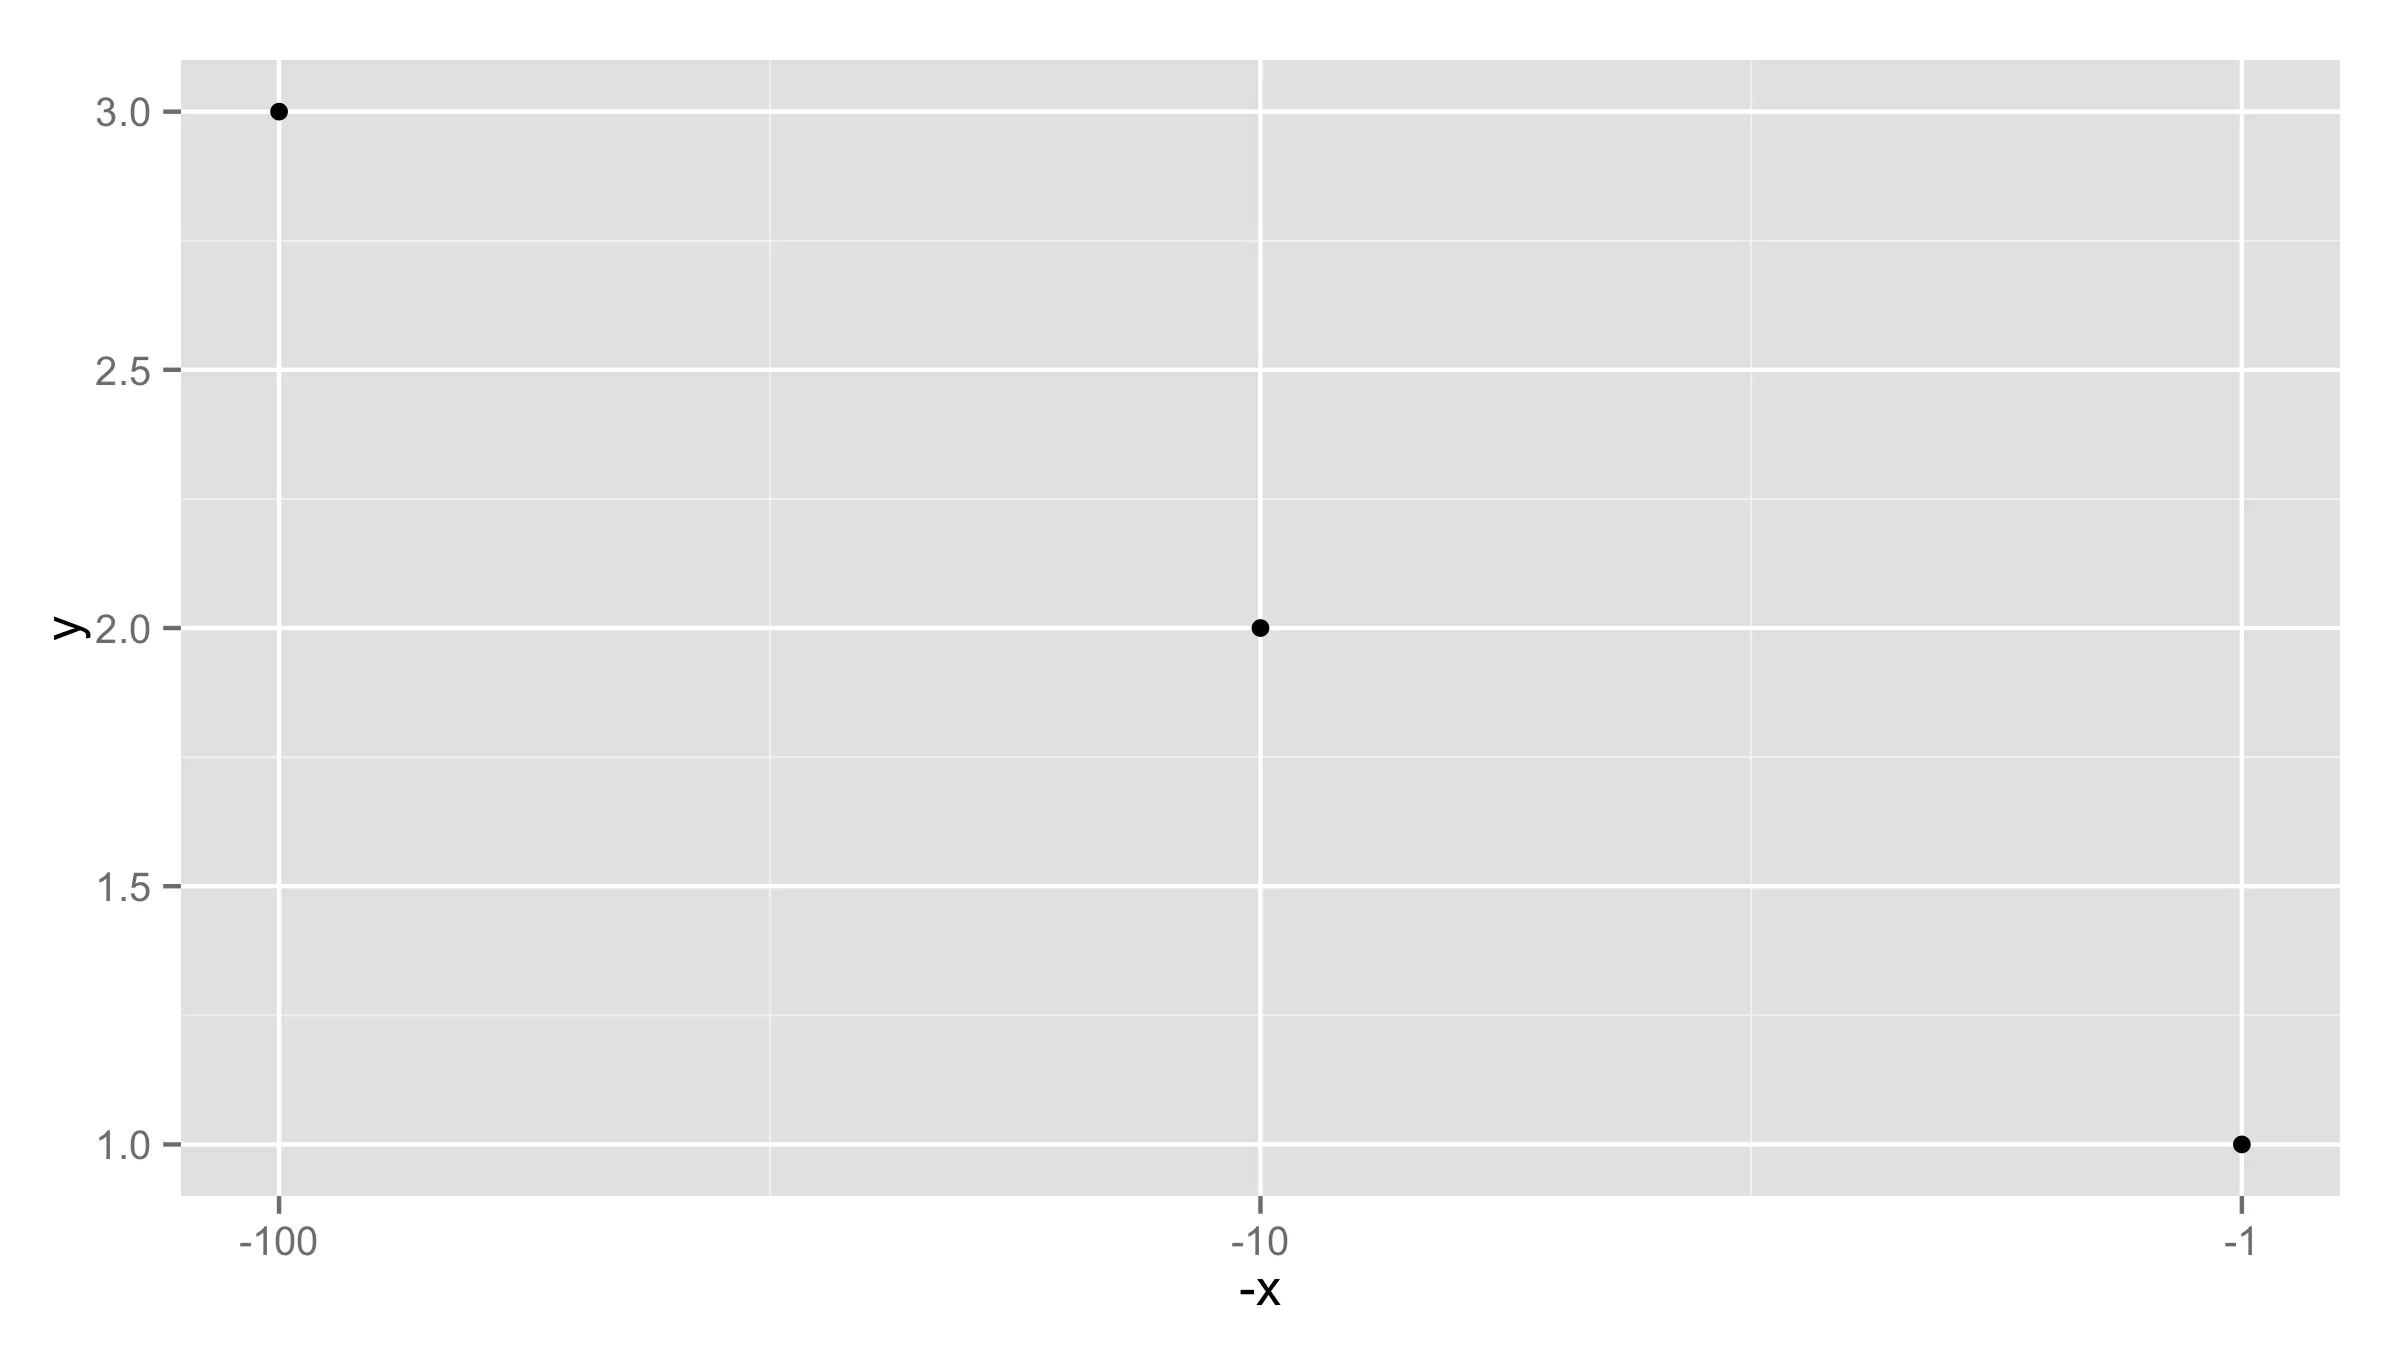
我知道在R中对负值取对数会产生NA值,但我需要像这样的结果:
这可以使用ggplot2来实现吗?
例如,我想使用对数刻度x轴来绘制这些点:
x <- c(-1,-10,-100)
y <- c(1,2,3)
我知道在R中对负值取对数会产生NA值,但我需要像这样的结果:
这可以使用ggplot2来实现吗?
x <- c(-1,-10,-100)
y <- c(1,2,3)
对于这个问题,我发现来自ggallin包的pseudolog10_trans转换非常有帮助,因为它可以适应对数比例尺上既有正数又有负数的情况。例如:
library(ggplot2)
library(ggallin)

x <- c(-1,-10,-100, 1, 10, 100)
y <- c(1,2,3, 1,2,3)

df = data.frame(x = x, y = y)

My_Plot = ggplot(
    df,
    aes(x=x, y=y)) +
    geom_point() +
    scale_x_continuous(trans = pseudolog10_trans)

My_Plot
library(scales)
reverselog_trans <- function(base = exp(1)) {
    trans <- function(x) -log(x, base)
    inv <- function(x) base^(-x)
    trans_new(paste0("reverselog-", format(base)), trans, inv,
              log_breaks(base = base),
              domain = c(1e-100, Inf))
}
df<-data.frame(x=c(-1,-10,-100),y= c(1,2,3))
ggplot(df,aes(-x,y))+geom_point()+
  scale_x_continuous(trans=reverselog_trans(base=10),
                     labels=trans_format("identity", function(x) -x))