在绘制数据之前,我会确保处理好缺失值。是否使用dropna()完全取决于数据集的性质。alcconsumption是单个系列还是数据框的一部分?在后者的情况下,使用dropna()也会删除其他列中相应的行。缺失值是少数还是众多?它们散布在系列中,还是倾向于成群结队地出现?或许您认为数据集存在趋势吗?
如果缺失值很少且分散,您可以轻松地使用dropna()。在其他情况下,我会选择用先前观察到的值填充缺失值(1)。或者甚至使用插值值来填充缺失值(2)。但要小心!用填充或插值观测值替换大量数据可能会严重干扰您的数据集,并导致非常错误的结论。
以下是一些示例,使用了您的片段...
seaborn.distplot(data['alcconsumption'],hist=True,bins=100)
plt.xlabel('AlcoholConsumption')
plt.ylabel('Frequency(normalized 0->1)')
在合成数据集上:
import pandas as pd
import numpy as np
import seaborn as sns
import matplotlib.pyplot as plt

def sample(rows, names):
    ''' Function to create data sample with random returns

    Parameters
    ==========
    rows : number of rows in the dataframe
    names: list of names to represent assets

    Example
    =======

    >>> sample(rows = 2, names = ['A', 'B'])

                  A       B
    2017-01-01  0.0027  0.0075
    2017-01-02 -0.0050 -0.0024
    '''
    listVars= names
    rng = pd.date_range('1/1/2017', periods=rows, freq='D')
    df_temp = pd.DataFrame(np.random.randint(-100,100,size=(rows, len(listVars))), columns=listVars)
    df_temp = df_temp.set_index(rng)


    return df_temp

df = sample(rows = 15, names = ['A', 'B'])
df['A'][8:12] = np.nan
df
输出:
            A   B
2017-01-01 -63.0  10
2017-01-02  49.0  79
2017-01-03 -55.0  59
2017-01-04  89.0  34
2017-01-05 -13.0 -80
2017-01-06  36.0  90
2017-01-07 -41.0  86
2017-01-08  10.0 -81
2017-01-09   NaN -61
2017-01-10   NaN -80
2017-01-11   NaN -39
2017-01-12   NaN  24
2017-01-13 -73.0 -25
2017-01-14 -40.0  86
2017-01-15  97.0  60
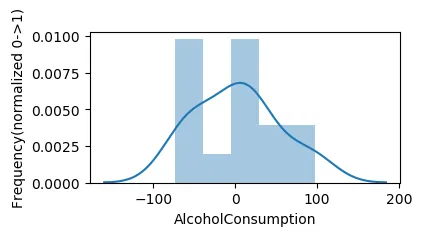
ffill 会“向前填充”值,意味着它会用上一行的值替换 nan。
df = df['A'].fillna(axis=0, method='ffill')
sns.distplot(df, hist=True,bins=5)
plt.xlabel('AlcoholConsumption')
plt.ylabel('Frequency(normalized 0->1)')
根据不同的方法进行插值。时间插值适用于每日及更高分辨率数据,以插值给定长度的间隔。
df['A'] = df['A'].interpolate(method = 'time')
sns.distplot(df['A'], hist=True,bins=5)
plt.xlabel('AlcoholConsumption')
plt.ylabel('Frequency(normalized 0->1)')
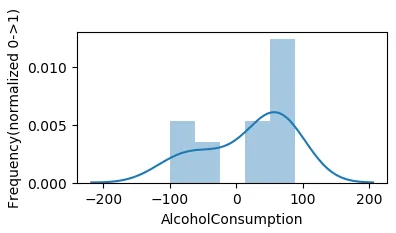
正如您所看到的,不同的方法呈现了两种非常不同的结果。我希望这对您有用。如果不是,请告诉我,我会再次查看它。
data['alcconsumption'].dropna()- mwaskom