每行计算比该行高的行数 Pandas

3

I have a 2 columns DataFrame:

positions = pd.DataFrame({"pos" : [1, 2, 3, 4, 5], "mcap" : [1, 4, 3, 2, 5]}, index = ["a", "b", "c", "d", "e"])

针对每个索引值,我需要找到2D世界中位于右上角的点数,即对于每条线,我需要计算比当前线高的线的数量。

因此,上面示例的答案将是:

pd.Series([4, 1, 1, 1, 0], index = ["a", "b", "c", "d", "e"])

我知道如何在循环中完成这个任务,但一旦数据框变得很大,这样做需要大量的计算时间,因此我正在寻找更多pythonic的解决方案。
编辑:通过循环实现简单的解决方案。
answer = pd.Series(np.zeros(len(positions)), index = ["a", "b", "c", "d", "e"])
for asset in ["a", "b", "c", "d", "e"]:
    better_by_signal = positions[positions["pos"] > positions["pos"].loc[asset]].index
    better_by_cap = positions[positions["mcap"] > positions["mcap"].loc[asset]].index
    idx_intersection = better_by_signal.intersection(better_by_cap)
    answer[asset] = len(idx_intersection)

在相等的情况下应该发生什么,例如,mcap:[1, 4, 3, 2, 4]?您的数据框中是否有任何NaN值? - Mr. T
@Mr.T,没有NaN值,实际上mcap和pos中的每个值都是唯一的,因此您可以假设任何内容(尽管我认为这不会对答案产生太大影响)。 - Artyom Akselrod
如果可能的话,请在您的问题中包含循环的解决方案,这将有助于。 - AJS
1
@AJS 我已经附上了循环解决方案。 - Artyom Akselrod
1
@ArtyomAkselrod 当存在NaN值时,一些numpy/pandas函数会返回意外的结果。 - Mr. T
4个回答

2
您可以使用 numpy 广播功能来查找 x 轴(pos)和 y 轴(mcap)的所有正差值对:
import numpy as np
import pandas as pd

positions = pd.DataFrame({"pos" : [1, 2, 3, 4, 5], "mcap" : [1, 4, 3, 2, 5]}, index = ["a", "b", "c", "d", "e"])

arrx = np.asarray([positions.pos])
arry = np.asarray([positions.mcap])
positions["count"] = ((arrx - arrx.T > 0) & (arry - arry.T > 0)).sum(axis = 1)

print(positions)

样例输出

   pos  mcap  count
a    1     1      4
b    2     4      1
c    3     3      1
d    4     2      1
e    5     5      0

我已经检查了所有建议的解决方案的速度,这个是最好的,与问题中的循环解决方案相比工作速度要快得多。 - Artyom Akselrod

0
使用map而不是循环索引,这应该可以工作:-
  import pandas as pd
  import numpy as np

  positions = pd.DataFrame({"pos" : [1, 2, 3, 4, 5], "mcap" : [1, 4, 3, 2, 5]}, index = ["a", "b", "c", "d", "e"])
  answer = pd.Series(np.zeros(len(positions)), index = ["a", "b", "c", "d", "e"])

  def set_pos(asset):
     better_by_signal = positions[positions["pos"] > positions["pos"].loc[asset]].index
     better_by_cap = positions[positions["mcap"] > positions["mcap"].loc[asset]].index
     idx_intersection = better_by_signal.intersection(better_by_cap)
     return len(idx_intersection)

  len_intersection = map(set_pos, answer.index.tolist())
  final_answer = pd.Series(len_intersection, index = answer.index.tolist())

这个解决方案与问题中建议的循环解决方案相比,只能略微提高速度。 - Artyom Akselrod

0
你可以使用列表推导式来代替for循环,像这样:
import pandas as pd
import numpy as np


positions = pd.DataFrame({"pos": [1, 2, 3, 4, 5], 
                          "mcap": [1, 4, 3, 2, 5]}, 
                         index=["a", "b", "c", "d", "e"]) 

# gives you a list:
answer = [sum(np.sum((positions - positions.iloc[i] > 0).values, axis=1) ==
              2) for i in range(len(positions))]

# convert list to a `pd.Series`:
answer = pd.Series(answer, index=positions.index)

这个解决方案似乎比问题中提到的循环更糟糕。它的运行速度几乎慢了4倍。 - Artyom Akselrod

0
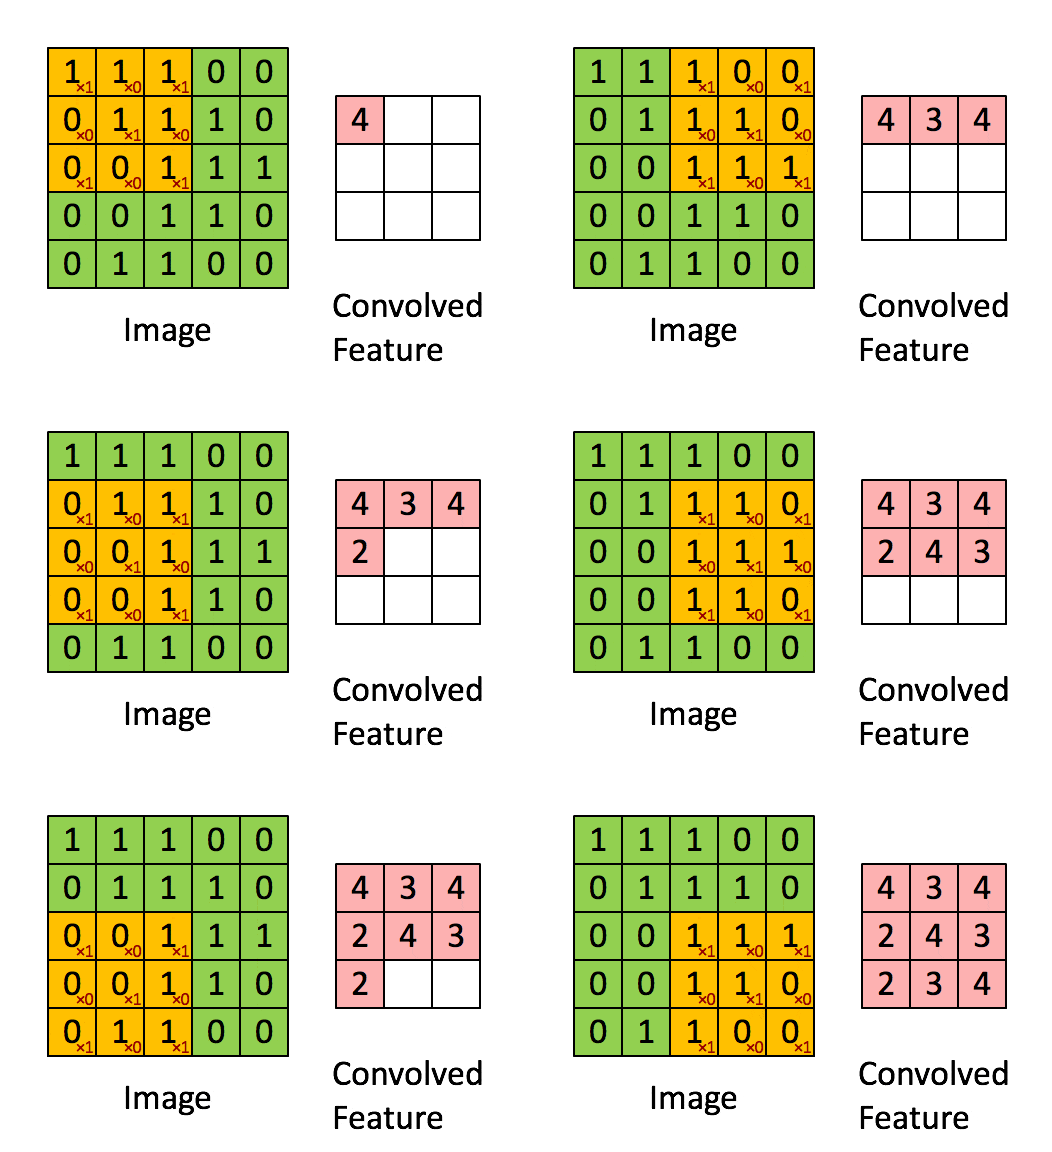
你可以使用卷积。卷积操作会做类似于这样的事情(更多信息在这里):

enter image description here

它将通过矩阵乘以您的过滤器或填充矩阵的元素,然后在这种情况下将它们相加。

对于这个问题,让我们首先向数据框添加一个新元素f,以便至少有一行具有多个元素。

>> positions

   pos  mcap
a    1     1
b    2     4
c    3     3
d    4     2
e    5     5
f    3     2

这些位置也可以被视为:

df = pd.crosstab(positions['pos'], positions['mcap'], 
                 values=positions.index, aggfunc=sum)

df

mcap    1    2    3    4    5
pos                          
1       a  NaN  NaN  NaN  NaN
2     NaN  NaN  NaN    b  NaN
3     NaN    f    c  NaN  NaN
4     NaN    d  NaN  NaN  NaN
5     NaN  NaN  NaN  NaN    e


df_ones = df.notnull() * 1

mcap  1  2  3  4  5
pos                
1     1  0  0  0  0
2     0  0  0  1  0
3     0  1  1  0  0
4     0  1  0  0  0
5     0  0  0  0  1

我们可以创建一个窗口,通过df_ones滑动并计算落在窗口内的元素数量之和。这被称为“卷积”(或相关性)。
现在让我们创建一个避开左上角元素的窗口(因此不计入统计),并将其与我们的df_ones进行卷积以获得结果:
pad = np.ones_like(df.values)
pad[0, 0] = 0

pad

array([[0, 1, 1, 1, 1],
       [1, 1, 1, 1, 1],
       [1, 1, 1, 1, 1],
       [1, 1, 1, 1, 1],
       [1, 1, 1, 1, 1]], dtype=object)


counts = ((signal.correlate(df_ones.values, pad,
                            mode='full')[-df.shape[0]:,
                                         -df.shape[1]:]) * \ 
          df_ones).unstack().replace(0, np.nan).dropna(
          ).reset_index().rename(columns={0: 'count'})

   mcap  pos  count
0     1    1    5.0
1     2    3    3.0
2     2    4    1.0
3     3    3    1.0
4     4    2    1.0

positions.reset_index().merge(counts, 
                              how='left').fillna(0
     ).sort_values('pos').set_index('index')

       pos  mcap  count
index                  
a        1     1    5.0
b        2     4    1.0
c        3     3    1.0
f        3     2    3.0
d        4     2    1.0
e        5     5    0.0

全部放在一个函数中:

def count_upper(df):
    df = pd.crosstab(positions['pos'], positions['mcap'],
                     values=positions.index, aggfunc=sum)
    df_ones = df.notnull() * 1

    pad = np.ones_like(df.values)
    pad[0, 0] = 0

    counts = ((signal.correlate(df_ones.values, pad,
                                mode='full')[-df.shape[0]:,
                                             -df.shape[1]:]) * df_ones)
    counts = counts.unstack().replace(0, np.nan).dropna(
    ).reset_index().rename(columns={0: 'count'})

    result = positions.reset_index().merge(counts,
                                         how='left')
    result = result.fillna(0).sort_values('pos').set_index('index')
    return result

对于您的示例,结果将与您期望的结果匹配:

positions = pd.DataFrame({"pos" : [1, 2, 3, 4, 5],
                          "mcap" : [1, 4, 3, 2, 5]},
                         index = ["a", "b", "c", "d", "e"])
>> count_upper(positions)
       pos  mcap  count
index                  
a        1     1    4.0
b        2     4    1.0
c        3     3    1.0
d        4     2    1.0
e        5     5    0.0
这段代码无法运行,报错为 NameError: name 'signal' is not defined - Artyom Akselrod

网页内容由stack overflow 提供, 点击上面的
可以查看英文原文,
原文链接